
TL;DR:
- Effective maintenance reduces the Six Big Losses that lower OEE by improving availability, performance, and quality. It involves predictive, preventive, and reliability-centered strategies to prevent breakdowns, optimize machine speed, and ensure product quality. Proper data tracking and asset prioritization are essential for maintenance to serve as a key production driver.
Overall Equipment Effectiveness (OEE) is defined as the product of three operational factors: Availability, Performance, and Quality. The role of maintenance in overall equipment effectiveness is to directly target each of these factors by eliminating the Six Big Losses that erode asset productivity. Predictive maintenance alone can reduce unplanned downtime by up to 50%, and structured maintenance programs have pushed OEE scores toward or beyond 90% in documented case studies. For operations managers and maintenance professionals, understanding this connection is the first step toward treating maintenance as a production driver rather than a budget line.
OEE scores below 85% signal that a facility is losing significant capacity. The Six Big Losses fall across all three OEE components: breakdowns and setup losses hit Availability; speed losses and minor stops hit Performance; defects and startup rejects hit Quality. Maintenance is the primary lever for reducing every one of these losses. Frameworks like Total Productive Maintenance (TPM) and Reliability-Centered Maintenance (RCM) formalize this connection, giving teams structured methods to assign maintenance activities to specific loss categories.
How does maintenance impact the availability component of OEE?
Availability measures the percentage of scheduled time that equipment actually runs. Mechanical breakdowns cause an average of 91.3 lost hours per line per year, with each event averaging 72 minutes. That figure alone justifies a shift from reactive to proactive maintenance.
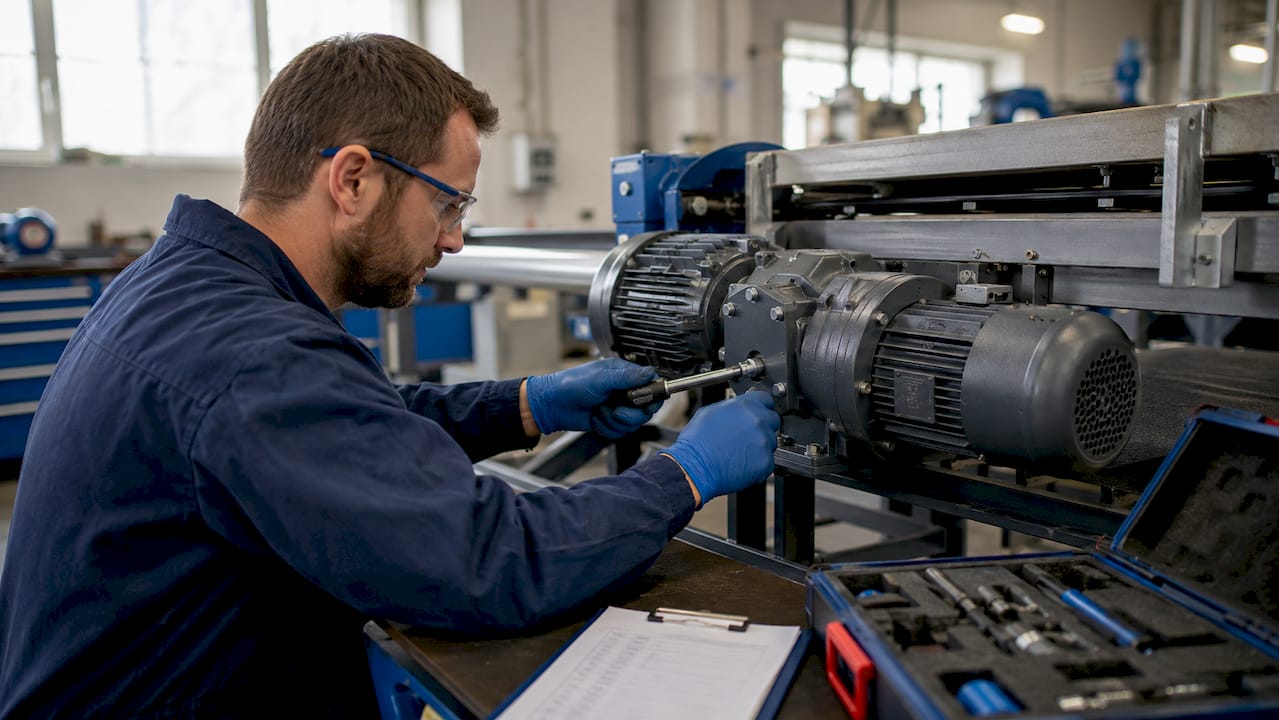
Preventive maintenance reduces unplanned downtime by catching failure modes before they cause stoppages. Predictive maintenance goes further by using sensor data and condition monitoring to schedule interventions only when equipment actually needs them. Both approaches directly improve Availability scores by keeping machines running during planned production windows.
The most effective maintenance teams address these specific availability killers:
- Unplanned breakdowns: Scheduled inspections and preventive maintenance programs catch wear before it becomes failure.
- Excessive changeover time: Standardized setup procedures and well-maintained tooling reduce transition losses.
- Startup delays: Pre-shift equipment checks prevent the slow ramp-up that eats into available run time.
- Planned downtime overruns: Accurate time estimates and parts availability keep scheduled maintenance within its window.
Pro Tip: Align maintenance windows with shift changeovers or scheduled production breaks. Performing planned maintenance during natural downtime periods protects Availability scores without creating additional production interruptions.
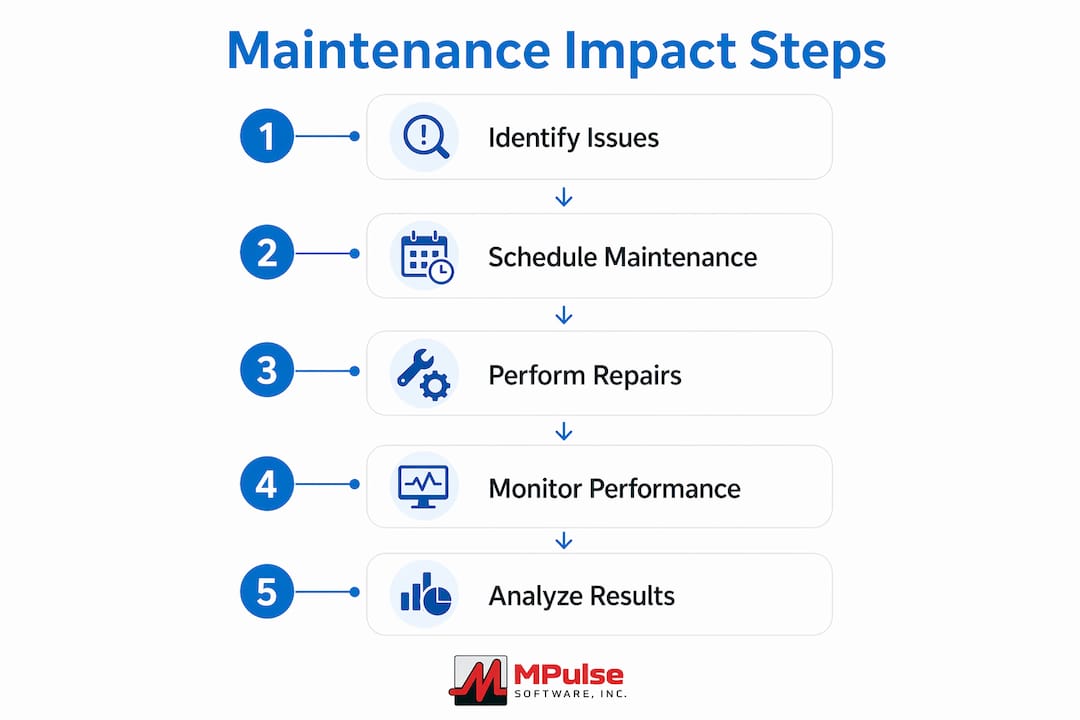
Scheduling maintenance well requires knowing which assets carry the highest production risk. Asset criticality analysis uses a matrix that weighs safety impact, production dependency, failure frequency, and repair cost to prioritize where maintenance resources go first. Teams that skip this step often spend time on low-impact assets while high-criticality equipment fails unexpectedly.
In what ways does maintenance improve performance efficiency within OEE?
Performance measures how closely equipment runs to its designed speed during actual operating time. Losses here come from slow cycles, minor jams, and idling. These losses are often invisible in daily operations because machines are technically “running,” just not at full capacity.
Specific maintenance interventions recover measurable performance. Bearing replacement recovers 8% performance loss, and proper lubrication schedules improve cycle time by 3–7%. These are not large capital projects. They are routine maintenance tasks with direct, quantifiable returns on Performance scores.
The table below shows common maintenance tactics and their primary impact on OEE Performance:
| Maintenance tactic | Performance impact |
|---|---|
| Bearing replacement | Recovers up to 8% performance loss |
| Lubrication schedule adherence | Improves cycle time by 3–7% |
| Sensor calibration | Reduces false stops and idling |
| Drive and motor inspection | Prevents speed degradation over time |
| Conveyor tension adjustment | Eliminates minor jams and micro-stops |
Process optimization is also part of the maintenance role. When maintenance teams document recurring minor stops, they create data that production engineers can use to redesign workflows. This cross-functional feedback loop is where maintenance moves from a reactive function to a genuine performance driver. For agricultural and industrial equipment alike, targeted preventive servicing practices follow the same logic: address wear patterns before they reduce output speed.
How does maintenance contribute to quality improvements in manufacturing?
Quality measures the proportion of output that meets specification on the first pass. Defects, rework, and startup rejects all reduce this score. Equipment that drifts out of calibration or runs with worn tooling produces off-spec parts, and those parts cost time and material to correct or discard.
Data-driven maintenance reduces product defects by 15% and cuts maintenance costs by 10%. The defect reduction comes from keeping equipment operating within its designed parameters rather than letting wear accumulate until quality problems appear on the line.
Maintenance best practices that directly protect Quality scores include:
- Calibration schedules: Sensors, gauges, and measurement systems need regular verification to catch drift before it affects output.
- Tooling replacement protocols: Worn cutting tools, molds, and dies produce dimensional variation. Scheduled replacement prevents defect spikes.
- Seal and gasket inspection: Fluid leaks and contamination cause surface defects and material waste in precision manufacturing.
- Operator maintenance training: Operators who understand basic equipment care catch early warning signs before defects reach the quality check.
- Post-maintenance quality checks: Running a short production sample after any maintenance intervention confirms the equipment is back within specification.
Startup rejects are a specific quality loss that maintenance directly controls. Equipment that sits idle overnight or between shifts often needs a warm-up period. Maintenance teams that document and standardize startup procedures reduce the number of off-spec parts produced at the beginning of each run.
What maintenance strategies optimize OEE effectively in modern operations?
Four maintenance strategies form the practical toolkit for OEE improvement. Each fits different asset types and criticality levels.
-
Preventive maintenance (PM): Time-based or usage-based interventions performed on a fixed schedule. PM works well for assets with predictable wear patterns and low condition-monitoring costs. Structured PM schedules significantly enhance OEE performance and reduce downtime across documented case studies.
-
Predictive maintenance (PdM): Condition-based interventions triggered by sensor data, vibration analysis, thermal imaging, or oil analysis. PdM reduces unnecessary maintenance on healthy assets and catches failures before they cause downtime. Predictive maintenance reduces unplanned downtime by 30% and improves quality by reducing defects by 15%.
-
Condition-based maintenance (CBM): Similar to PdM but typically uses simpler threshold monitoring rather than advanced analytics. CBM is a practical middle ground for facilities that are not yet ready for full predictive programs.
-
Reliability-Centered Maintenance (RCM): A systematic process that identifies the most effective maintenance approach for each asset based on its failure modes and consequences. RCM prevents both under-maintenance and over-maintenance by matching strategy to asset behavior.
Avoiding over-maintenance is as important as avoiding under-maintenance. Applying intensive PM schedules to low-criticality assets wastes labor and parts without improving OEE. Asset criticality analysis prevents this by directing resources where they produce the highest return.
Pro Tip: Master the fundamentals before adopting AI diagnostics. Standardizing work orders, training technicians, and achieving consistent PM compliance are prerequisites for getting value from advanced predictive tools. Skipping this foundation produces unreliable data that undermines any analytics program.
Doing predictive maintenance correctly requires clean baseline data, trained technicians, and a clear escalation path when sensors flag anomalies. Technology alone does not improve OEE. The process behind the technology does.
How can organizations measure the impact of maintenance on OEE?
Measuring maintenance impact on OEE requires collecting honest data at the component level. Teams that track only a single OEE number miss the diagnostic value that Availability, Performance, and Quality scores provide separately.
OEE should foster collaboration between maintenance and production teams to address root causes of the Six Big Losses. Using OEE data to assign blame to operators or maintenance technicians destroys the trust needed for accurate reporting. Accurate reporting is the foundation of continuous improvement.
Key metrics for tracking maintenance effectiveness include:
- Mean Time Between Failures (MTBF): Rising MTBF confirms that maintenance interventions are extending equipment life.
- Mean Time to Repair (MTTR): Falling MTTR shows that maintenance teams are resolving failures faster and more efficiently.
- PM compliance rate: The percentage of scheduled maintenance tasks completed on time. Low compliance predicts future availability losses.
- Planned vs. unplanned maintenance ratio: A higher ratio of planned work indicates a proactive maintenance culture.
- Defect rate post-maintenance: Tracks whether maintenance interventions are restoring quality performance.
These metrics connect directly to OEE components. MTBF and MTTR map to Availability. PM compliance and minor stop frequency map to Performance. Defect rates post-maintenance map to Quality. When maintenance teams report these KPIs alongside OEE scores, the connection between maintenance activity and production outcomes becomes visible and defensible.
Key Takeaways
Maintenance is the primary operational lever for improving OEE because it directly targets Availability, Performance, and Quality losses through structured, data-driven interventions.
| Point | Details |
|---|---|
| Maintenance drives all three OEE factors | Availability, Performance, and Quality each have specific maintenance interventions that reduce losses. |
| Downtime is quantifiable and preventable | Mechanical breakdowns average 91.3 lost hours per line per year; predictive maintenance cuts unplanned downtime by up to 50%. |
| Lubrication and bearing work pay off | Bearing replacement recovers 8% performance loss; lubrication schedules improve cycle time by 3–7%. |
| Data-driven maintenance reduces defects | Structured maintenance programs reduce product defects by 15% and cut maintenance costs by 10%. |
| Asset criticality guides resource allocation | Applying the right maintenance strategy to the right asset prevents over-maintenance and focuses effort where OEE impact is highest. |
The case for treating maintenance as a production function
Most facilities I have observed still treat maintenance as a cost center. The budget conversation focuses on labor hours and parts spend, not on the production capacity that maintenance either protects or fails to protect. That framing is the single biggest obstacle to OEE improvement I have seen across manufacturing environments.
The shift that actually moves OEE numbers is cultural before it is technical. When maintenance teams sit in production planning meetings, when PM compliance appears on the same dashboard as output targets, and when MTBF trends are reviewed alongside quality reports, maintenance stops being a support function and starts being a production function. That integration is what separates facilities running at 65% OEE from those running at 85%.
The other pattern worth naming is the rush to advanced technology. Sensor networks and AI diagnostics are genuinely useful, but they amplify whatever process exists underneath them. Facilities that have not standardized work orders or achieved consistent PM compliance get noisy, unreliable data from their sensors. The technology investment produces nothing. The sequence matters: fundamentals first, then condition monitoring, then predictive analytics. Every facility that has successfully moved OEE past 85% I have studied followed that order, not the reverse.
— Mark
How MPulse Software supports maintenance-driven OEE improvement
Operations teams that want to connect maintenance activity to OEE outcomes need more than spreadsheets and manual tracking.
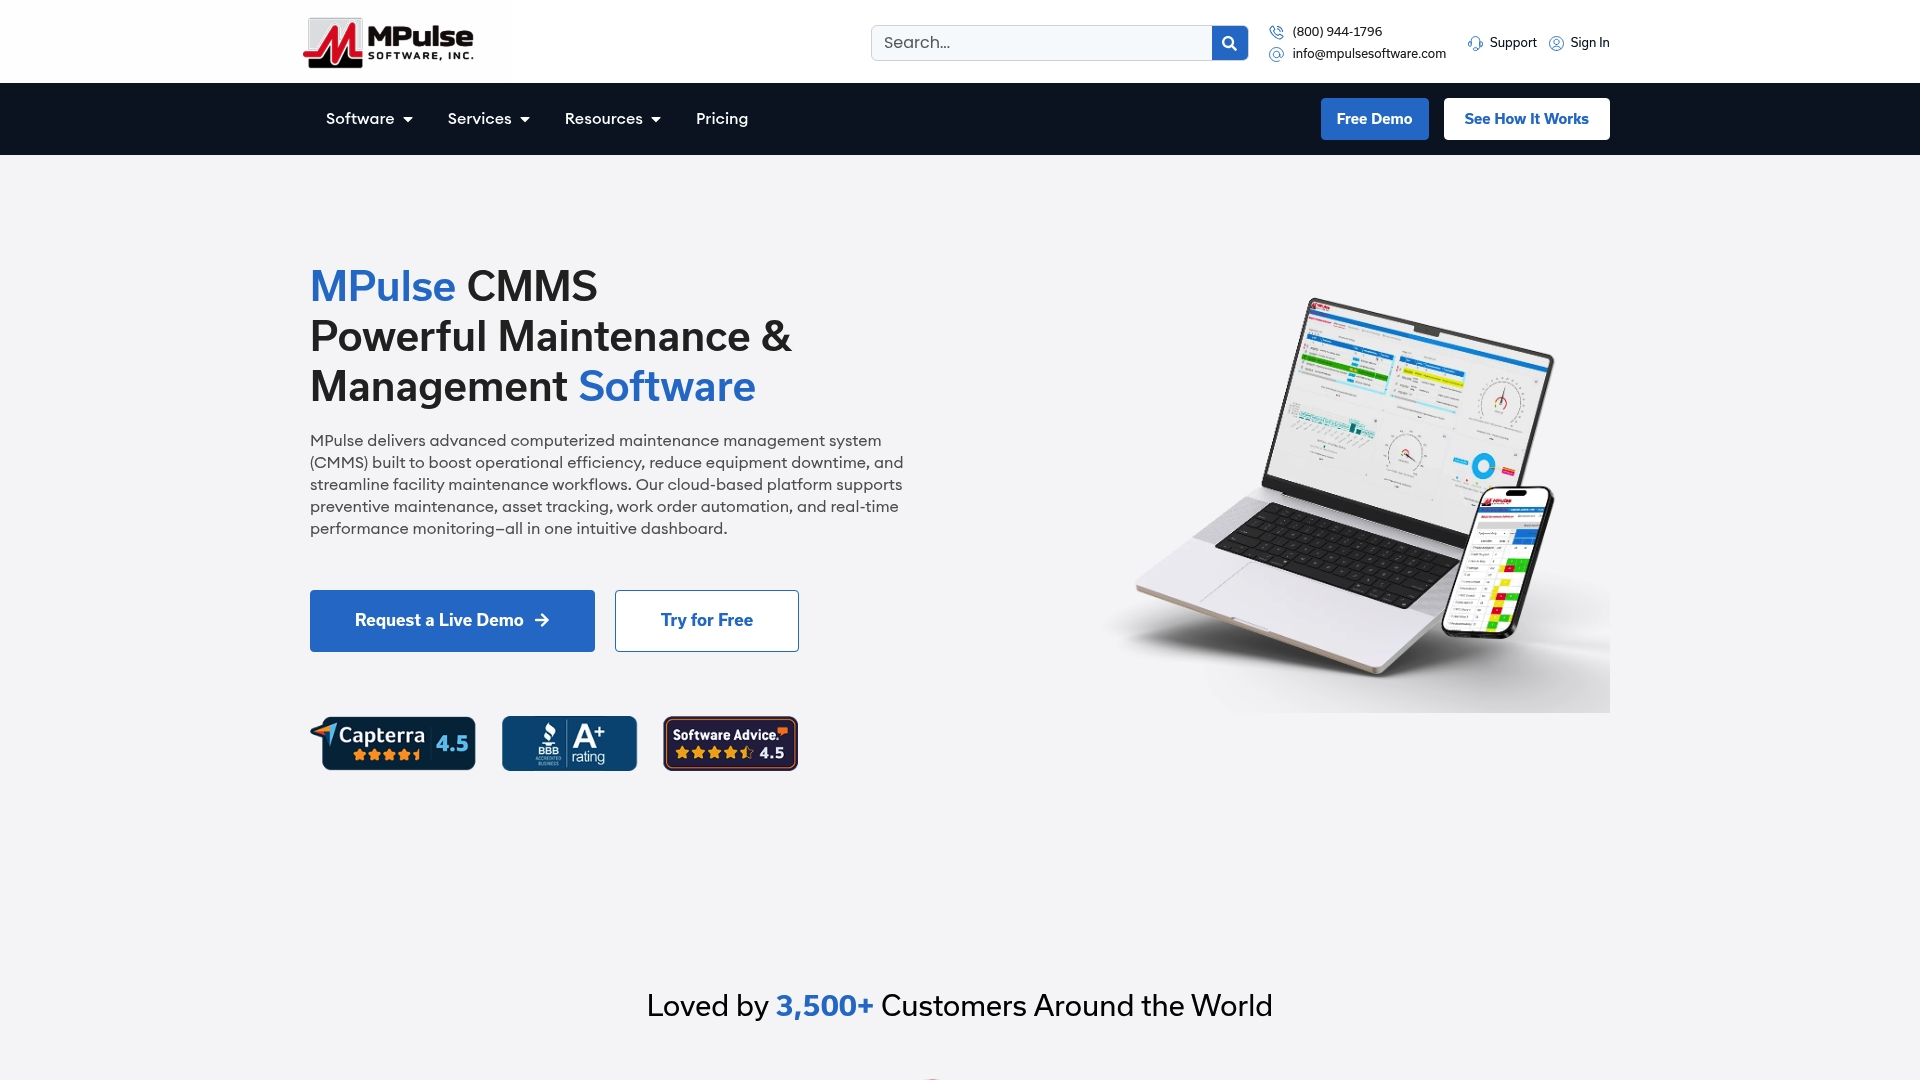
MPulse Software gives maintenance and operations teams the tools to act on OEE data directly. The platform’s preventive maintenance scheduling automates PM compliance tracking, while the real-time monitoring features connect sensor data to work order generation. The asset status board gives operations managers a live view of equipment condition across the facility. Over 3,500 customers globally have used MPulse CMMS to achieve efficiency improvements of up to 40%. Explore the full platform at MPulse CMMS to see how it fits your maintenance program.
FAQ
What is the role of maintenance in overall equipment effectiveness?
Maintenance directly improves OEE by reducing the Six Big Losses across Availability, Performance, and Quality. Predictive and preventive maintenance programs reduce unplanned downtime, recover performance losses, and keep equipment operating within quality parameters.
How does unplanned downtime affect OEE availability scores?
Mechanical breakdowns average 91.3 lost hours per line per year, each event lasting about 72 minutes. Every unplanned stoppage reduces the Availability component of OEE and compounds losses across the shift.
Which maintenance strategy has the biggest impact on OEE?
No single strategy fits every asset. Predictive maintenance reduces unplanned downtime by 30% and defects by 15%, making it highly effective for critical assets. Preventive maintenance delivers consistent OEE gains for assets with predictable wear patterns.
How do you measure maintenance effectiveness using OEE?
Track MTBF, MTTR, PM compliance rate, and planned-to-unplanned maintenance ratio alongside OEE component scores. Rising MTBF and falling MTTR confirm that maintenance interventions are improving Availability and reducing production losses.
What is over-maintenance and why does it matter for OEE?
Over-maintenance means applying intensive maintenance schedules to assets where the cost and disruption exceed the reliability benefit. Asset criticality analysis prevents this by matching maintenance intensity to each asset’s actual impact on production and OEE.