
CMMS reports provide the insight you need to accurately assess how your department is functioning—and where you can make changes. Custom report tools and software give you easy access to the numbers you need to make important decisions.
A custom project report can help you run your maintenance team, as well as measure and use key performance indicators (KPIs).
MPulse 9 comes with over 300 pre-configured text and graphical reports, so often you can find what you’re looking for easily. However, sometimes you need to build highly customized reports.
Here’s how to create and manage custom reports in MPulse.
Step 1: What Type of Report Do You Need?
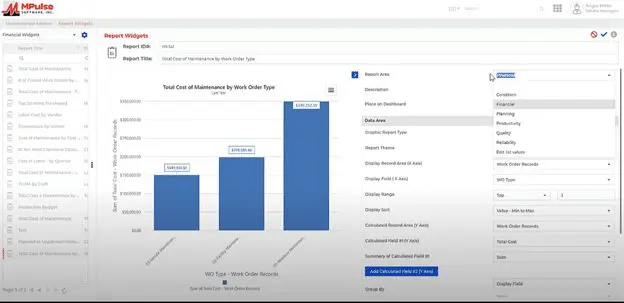
MPulse makes it easy to build custom reports internally. Start by choosing Report Widgets from the main menu.
- In the top left corner, you can choose the type of report you need (financial, production, planning, etc.). That gives you a good starting point to build your custom report. You also can change the type of report in the Report Area field at the top right side.
- Add any custom information to the Description field.
- Check Add to Dashboard if you want the report to display on your personal dashboard.
Step 2: Set Parameters
Now it’s time to use MPulse’s custom report builder tools to design your report. You can use MPulse’s custom report designer tools to quickly produce status reports and documents giving details or summaries of your team’s maintenance work.
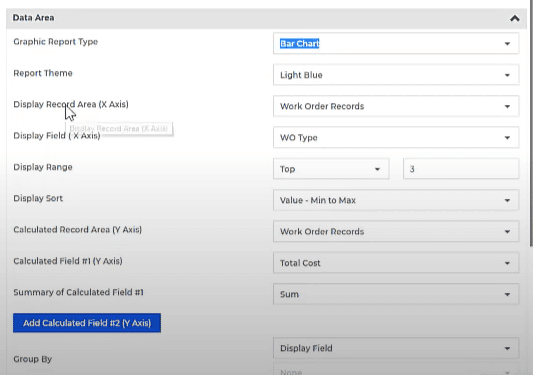
In the Data Area section, you have several choices.
- Select the Graphic Report Type you want.
- Choose the Record Area and Field you want for the x-axis of your chart.
- Pick the Display Range and Display Sort.
- Enter the Calculated Area and Calculated Field you want for the y-axis of your chart.
- Choose the Summary of Calculated Field #1 for the type of summary data you want.
- If you want a second calculated field, click on Add Calculated Field (#2) and follow the same steps to set the parameters.
Step 3: Choose Options
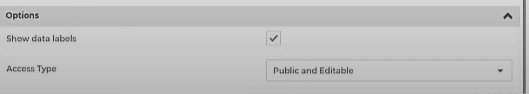
Under Options, you can…
- Click Show data labels, if you want to display labels.
- Set the Access Type to control who can access or edit the report.
Step 4: Save the Report
- Click the Save button at the top right corner of the screen.
With MPulse Software’s CMMS solutions, you can create simple, easy-to-read graphic reports with just a few clicks. Our reporting features enable you to…
- Select from over 300 pre-configured text and graphical reports
- Easily build your own reports in the MPulse Report Builder
- Customize your reports or create graphical views
- Produce status reports and documents giving details or summaries of your team’s maintenance work
- Create benchmarks for your organization
With solid data and easy-to-read reports, your organization can make good decisions based on hard evidence, which also will improve its ability to compete effectively and efficiently.
Contact us to learn more.