
Maintenance Reporting Software That Turns Work History into Decisions
Every work order your team completes holds data about assets, labor, parts, and cost. MPACT CMMS by MPulse Software turns that history into reports you can act on, and export when leadership asks for the numbers.
Reporting built on 20+ years of maintenance software experience from MPulse Software
What Is CMMS Reporting?
CMMS reporting turns maintenance records into usable information: which assets cost the most, whether preventive maintenance is getting done, where downtime comes from, and how labor hours are spent. In MPACT, reports draw on every work order, asset, part, and schedule in the system, so the numbers reflect what actually happened on the floor.
The Data Is in the System. The Answers Should Be Too.
Most maintenance teams capture plenty of data and still answer questions by gut feel, because getting a number out of the system takes longer than the meeting where someone asked for it. Budget season becomes an archaeology project. Repair-or-replace decisions get made without the repair history.
MPACT closes that gap. Reports are built into the same system your team uses to do the work, so the numbers stay current without exports, re-keying, or a spreadsheet that only one person understands.
Reporting Built for Maintenance Operations.
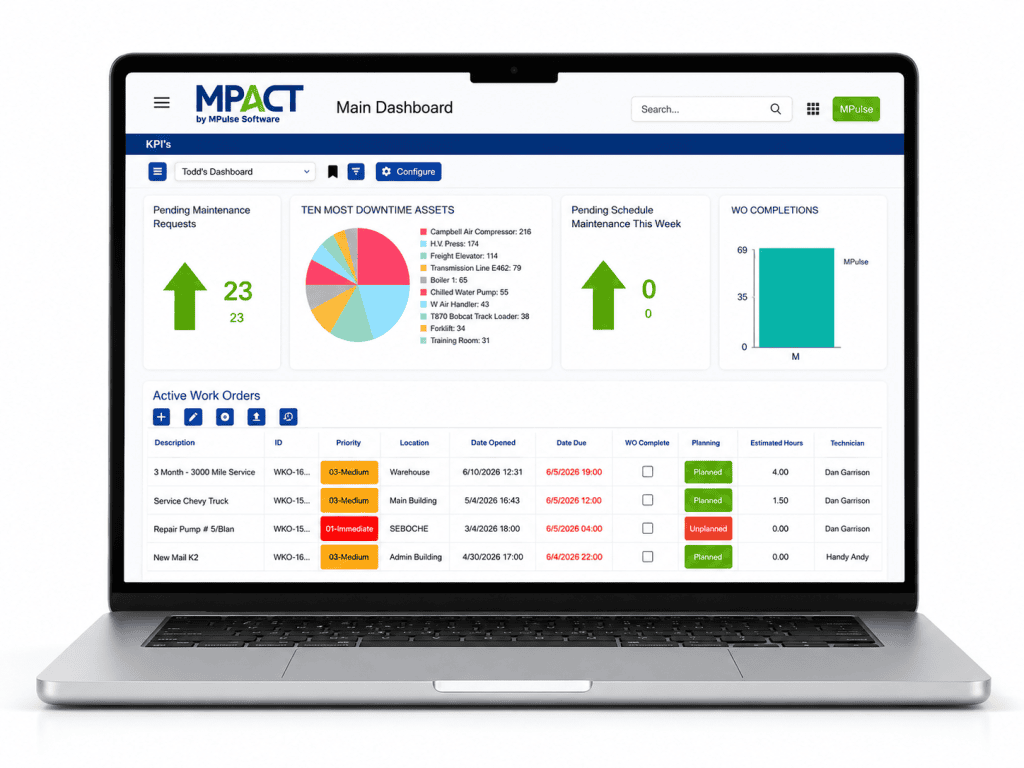
Pre-built KPI stat tiles
Standard tiles cover the measures maintenance teams track most, so you get useful numbers on day one instead of starting from a blank canvas.
Unlimited Custom and Private Reports
Dynamic Grid Reports & Graphical Views
Real-time Cost and Historical Reporting
Export to PDF, XLS, and CSV
Custom Calculated Fields
Reports Maintenance Managers Actually Run
PM Compliance
Scheduled work completed on time vs overdue, by site or team.
Cost Per Asset
Labor, parts, and downtime rolled up by asset, so repair-or-replace decisions use real history.
Downtime and Failure Analysis
Where downtime comes from and which failure codes repeat.
Backlog and Workload
Open work orders by priority, age, and assignee.
Parts Usage
What was consumed, on which assets, and what it cost.
Labor Analysis
What location, asset, or production line is requiring the most labor.
Reports or Dashboards? You Use Both.
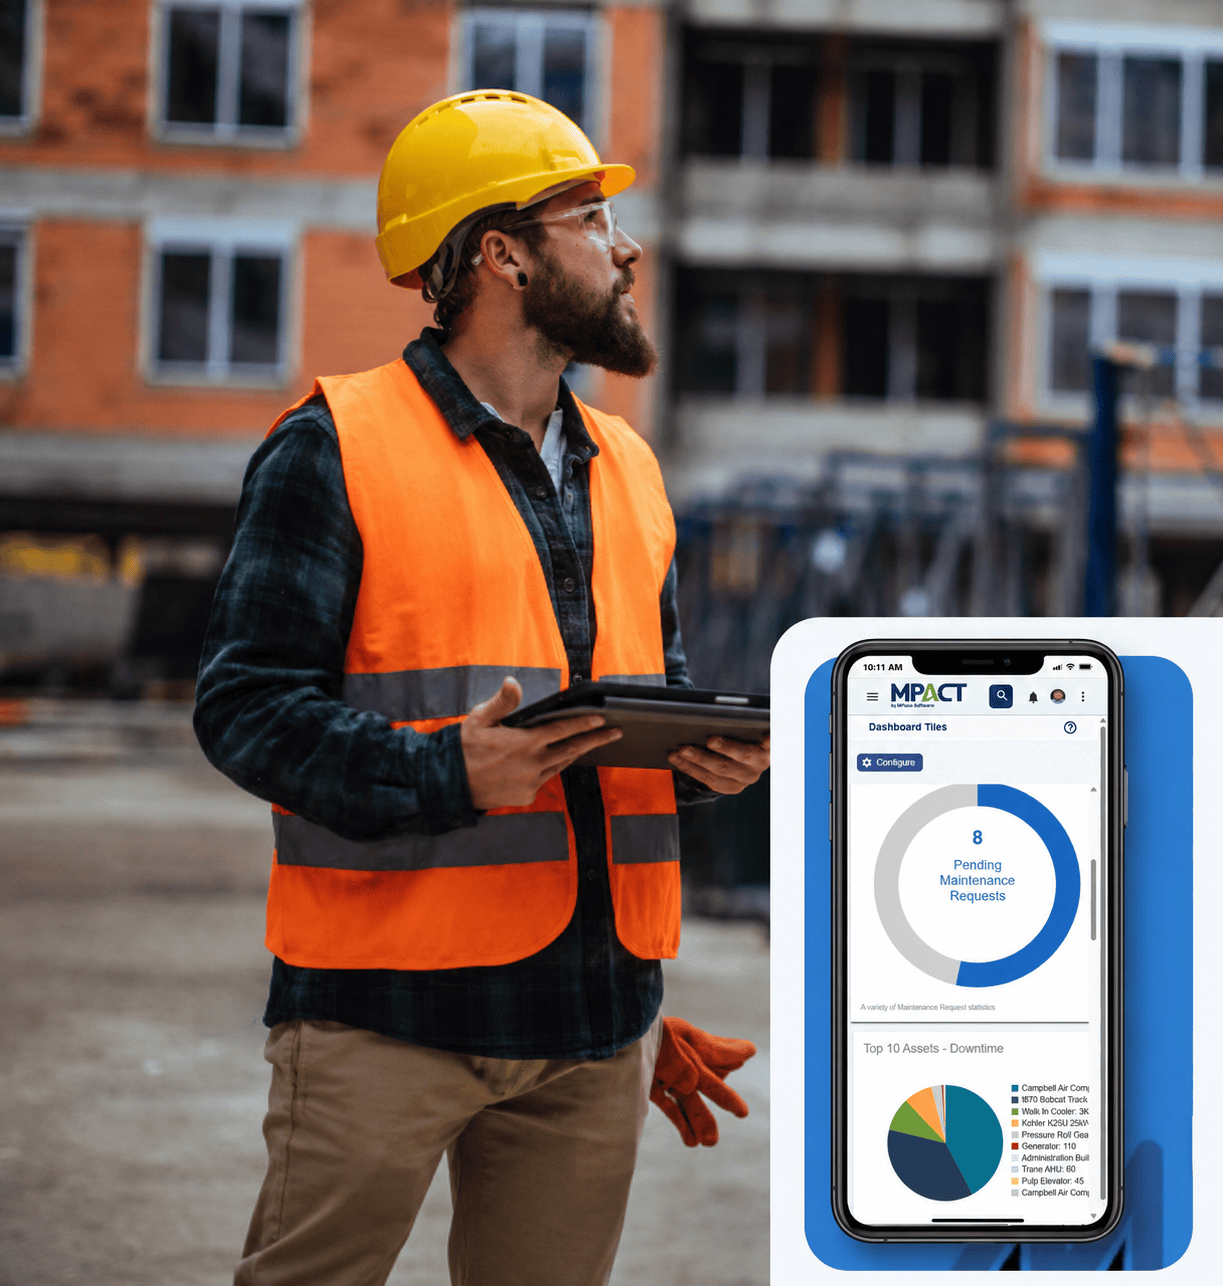
Dashboards answer what needs attention right now: each user’s live view of KPIs, work, and schedules. Reports answer what happened and what it cost: the analysis you build, refine, and export. MPACT includes both, drawing on the same records.
Frequently Asked Questions About CMMS Reporting
Why is CMMS reporting important?
A CMMS collects data across your entire asset inventory with every work order and PM task. Reporting is how that data pays for itself: it shows what maintenance costs, which assets drain the budget, and whether your program is working, so decisions like repair-or-replace rest on history instead of guesswork.
What is a CMMS report?
A CMMS report is a structured view of your maintenance records: costs, trends, compliance, and history for a chosen scope and time period. Because MPACT tracks time, cost, and parts on every work order, a report can tell you exactly what a specific asset or work type costs over any timeframe.
What questions can maintenance reports answer?
Start with the basics: what type of maintenance costs the most, how preventive costs compare to repair costs, and how this year compares to last. Then get specific: why costs are high on one line, whether new equipment would cost less than maintaining the old, and how long the payback would take.
What formats can I export MPACT reports to?
PDF, XLS, and CSV. Grid reports and graphical views can both be exported, so the same data works for a leadership summary or a finance model.
How do I start using CMMS reports?
Begin with the decisions you already make: budgets, staffing, repair-or-replace. Identify the numbers that would make each decision easier, then build a report that produces those numbers. MPACT’s pre-built KPI tiles cover the common starting points, and custom reports take over from there.
Ready to See Your Maintenance Data Working?
Bring a question you cannot currently answer, and we will show you the report that answers it. Demos can be built around your own data.