
TL;DR:
- A maintenance service dashboard consolidates real-time operational and financial data to enable faster decision-making. It displays KPIs like job statuses, PM compliance, and margins, supporting diverse roles from field technicians to owners. Implementing such dashboards requires careful data integration, role-specific design, and a disciplined rollout process.
A maintenance service dashboard is a real-time visual command center that consolidates work orders, asset health, KPIs, and financial metrics into a single interactive display, giving contractors the operational and financial visibility they need to make faster, more confident decisions.
- What it shows: Open and overdue jobs, PM compliance rates, technician utilization, job-level margins, parts availability, and equipment health, all updated continuously from your CMMS, telematics, and accounting systems.
- Immediate operational benefit: Real-time dashboards reduce the time between problem detection and corrective action by 67% compared to monthly reporting, replacing reactive firefighting with proactive scheduling.
- Financial benefit: Connecting job-level cost data to operational workflows lets managers spot margin erosion before it affects contract profitability.
Verdict: The single most important reason to adopt a contractor service dashboard is that it turns scattered field data into a live financial and operational picture, so you can act on problems in minutes, not weeks.
Table of Contents
- What does a maintenance service dashboard actually contain?
- What KPIs should contractors track on a maintenance dashboard?
- Which types of maintenance dashboards do contractors use most?
- How are dashboards different from traditional maintenance reports?
- How do you build an effective maintenance dashboard step by step?
- What do contractor-specific dashboard views look like in practice?
- What does a realistic dashboard rollout look like for contractors?
- Key Takeaways
- The dashboard gap most contractors don’t see until it’s too late
- MPulse Software: built for the KPIs that matter to contractors
- Useful sources and further reading
- FAQ
What does a maintenance service dashboard actually contain?
A contractor dashboard pulls data from multiple systems and presents it in one place. The core inputs are your CMMS (work orders, asset records, PM schedules), IoT or telematics feeds (engine hours, equipment condition), and financial or ERP data (labor costs, invoice status, job margins). Modern dashboards can refresh in minutes or seconds and support drill-downs directly into source records, so a manager who sees a spike in overdue work orders can click through to the specific jobs, assets, and technicians involved.
The anatomy of a typical contractor dashboard includes several distinct layers. At the top level, KPI tiles give a snapshot of the metrics that matter most right now. Below that, filters let users slice data by site, asset class, crew, or date range. Drill-down capability connects each tile to the underlying work orders, inventory transactions, or cost records. Role-based views control what each user sees, and alerting rules push notifications when a threshold is crossed. Mobile access lets field technicians log updates, photos, and notes in real time, keeping the office picture accurate without manual data entry.
Role-specific use looks different across a typical contracting organization:
- Owner/principal: Monitors job-level margins, revenue trends, and invoice aging.
- Maintenance manager: Tracks PM compliance, equipment downtime, and backlog.
- Dispatcher: Uses the job board to assign technicians, monitor ETAs, and manage schedule pressure.
- Field technician: Views assigned tasks, parts availability, and asset history from a mobile device.
What KPIs should contractors track on a maintenance dashboard?
The right KPIs for contractors connect operational performance directly to financial outcomes. Tracking vanity metrics like total work orders closed tells you very little; tracking job-level margin alongside PM compliance tells you whether your crews are profitable and whether your assets are being maintained before they fail.
Core KPIs for a contractor service dashboard:
- Open and overdue jobs: Count of active work orders past their due date. Drives immediate dispatch decisions.
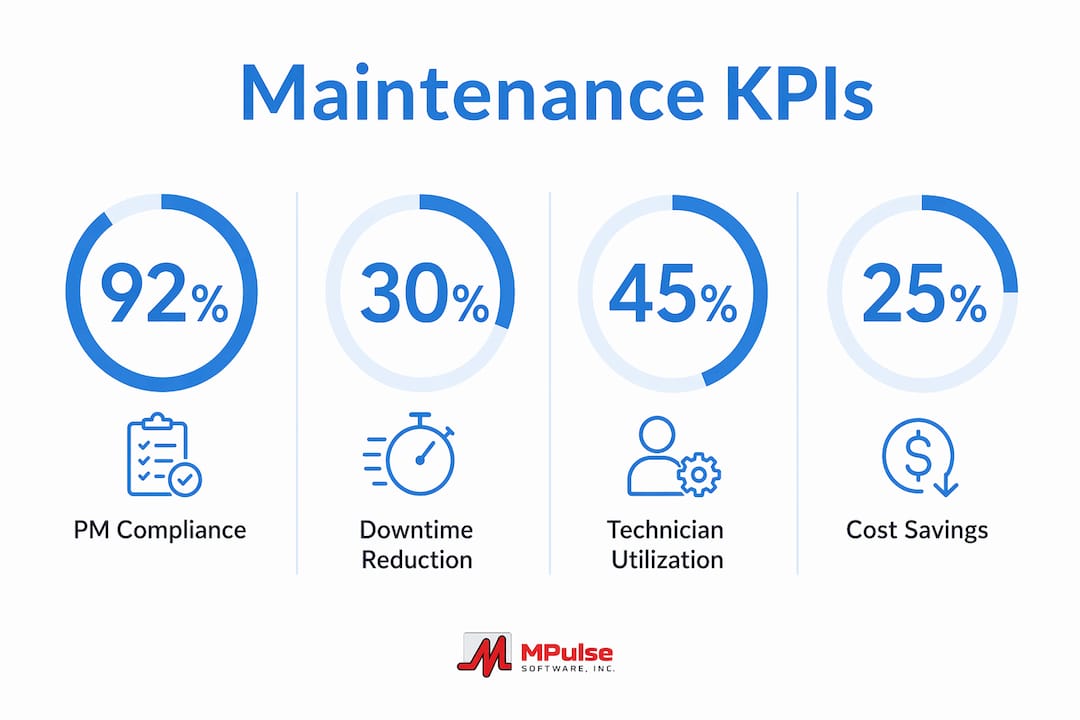
- PM compliance: Completed PMs ÷ scheduled PMs × 100. A rate below 85% typically signals scheduling gaps or parts shortages.
- Technician utilization: Billable hours ÷ total available hours × 100. Identifies underused capacity or overloaded crews.
- Mean Time to Repair (MTTR): Total repair time ÷ number of repairs. Lower is better; rising MTTR signals skill gaps or parts delays.
- Mean Time Between Failures (MTBF): Total uptime ÷ number of failures. Rising MTBF indicates improving asset reliability.
- Backlog: Total hours of open work orders ÷ available crew hours. A backlog above two weeks usually requires staffing or scheduling intervention.
- Job-level margin: (Job revenue minus job costs) ÷ job revenue × 100. The most direct indicator of contract profitability.
- Cost of labor: Actual labor hours × loaded rate per job. Separating contractor vs. internal labor costs helps managers decide whether to hire permanent staff.
- Spare-parts days on hand: Current parts inventory ÷ average daily usage. Prevents emergency procurement that inflates job costs.
- Invoice status: Percentage of completed jobs invoiced and percentage of invoices paid within terms.
For an operational view (maintenance managers, dispatchers), prioritize open jobs, overdue jobs, PM compliance, technician utilization, and parts availability. For an executive view (owners, operations directors), lead with job-level margin, MTTR, MTBF, invoice aging, and backlog. KPIs like PM compliance and technician utilization belong on both views because they connect daily operations to financial outcomes. For deeper KPI definitions and formulas, the MPulse KPI reference is a practical starting point.
Which types of maintenance dashboards do contractors use most?
Not every contractor needs the same view. The five dashboard types below cover the most common needs, and most platforms let you run several simultaneously once the data integrations are in place.
- CMMS operations dashboard: The foundational view. Displays work order status, PM schedule adherence, technician assignments, and backlog. Every contractor should build this first.
- Asset health / condition-based dashboard: Tracks equipment condition scores, failure history, and maintenance cost per asset. Best suited for contractors managing heavy equipment fleets or critical building systems.
- Predictive / AI dashboard: Uses sensor data and failure patterns to forecast when an asset is likely to fail. Most valuable for contractors with high-value equipment where unplanned downtime carries significant cost.
- Inventory and parts dashboard: Monitors stock levels, reorder points, parts consumption by job, and supplier lead times. Particularly useful for multi-site contractors where parts shortages cause schedule delays.
- Field / contractor operations dashboard: Combines job-board visibility, technician location, vehicle status, and customer communication into a single dispatch-focused view. The primary tool for service coordinators and dispatchers.
Starting with a single, role-specific dashboard, typically the CMMS operations view, is the most reliable path to adoption. Multi-view solutions add value once the underlying data is clean and the team trusts the numbers.
How are dashboards different from traditional maintenance reports?

The distinction matters because using the wrong tool for the situation costs time and credibility.
| Dimension | Dashboard | Maintenance report |
|---|---|---|
| Data currency | Real-time or near-real-time | Historical (weekly, monthly, quarterly) |
| Interactivity | Drill-down into source records | Static output (PDF, spreadsheet) |
| Primary purpose | Trigger immediate action | Audit, compliance, financial reconciliation |
| Review cadence | Continuous monitoring | Periodic scheduled review |
| Audience | Operations teams, field supervisors | Executives, auditors, clients |
A dashboard triggers action when a PM compliance rate drops below threshold mid-week, when a technician’s utilization spikes above capacity, or when an asset’s failure count rises sharply. A report is the right artifact when you need to demonstrate compliance to a client, reconcile month-end labor costs against invoices, or document equipment history for a contract audit.
The practical answer for most contractors: use dashboards for daily and weekly operations, and generate reports for billing cycles, compliance submissions, and contract reviews. The two tools serve different audiences and different time horizons. For contractors managing preventive maintenance contracts, reports provide the audit trail that dashboards cannot replace.
How do you build an effective maintenance dashboard step by step?
Implementation succeeds or fails based on data quality and role alignment, not on the sophistication of the software. Follow this checklist in order.
Implementation checklist:
- Define stakeholders and roles. Identify who will use the dashboard daily (dispatchers, maintenance managers) versus who will review it weekly (owners, operations directors). Each role needs a different view.
- Prioritize KPIs by role. Limit each view to 6–8 KPIs. More than that creates cognitive overload and reduces the dashboard to a data dump.
- Map your data sources. Confirm which systems hold the data each KPI requires: CMMS for work orders and PM records, telematics for engine hours, ERP or accounting for costs and margins.
- Design tiles and drill-downs. Build each tile so users can click through to the source records. A PM compliance tile that shows your current completion rate is useful; one that lets you click into the missed PMs to see which assets and technicians are involved is what drives action.
- Configure alerts and thresholds. Set automated notifications for overdue jobs, low parts stock, PM compliance below target, and MTTR above acceptable range.
- Pilot with one crew or site. Run a 30-day pilot before full rollout. Measure whether the team actually uses the dashboard and whether the data matches reality.
- Iterate based on usage. Remove tiles nobody opens. Add drill-downs where managers are manually pulling reports to answer questions the dashboard should answer automatically.
Integration checklist:
- CMMS work orders and asset records
- Telematics or fleet management system for engine hours and location
- Inventory system for parts stock and reorder status
- ERP or accounting platform for job costs, labor rates, and invoice status
- Mobile app for field technician updates and photo documentation
- Barcode scanning for parts consumption and asset identification
Pro tips for avoiding common pitfalls:
Pro Tip: Set data ownership before go-live. Assign one person per data source who is responsible for accuracy. Without ownership, data drift, where manual field entries diverge from actual equipment hours or job status, will erode trust in the dashboard within weeks.
Pro Tip: Integrate telematics directly into your CMMS rather than relying on technicians to log engine hours manually. Telematics integration eliminates a common source of PM schedule errors and keeps maintenance triggers accurate.
For step-by-step setup guidance specific to CMMS dashboards, the MPulse dashboard setup guide covers tile configuration and role-based access in practical detail.
What do contractor-specific dashboard views look like in practice?
The widgets that matter most for contractors connect field activity to financial outcomes. Here are the five most impactful tiles and three real-world scenarios that show what changes when contractors adopt them.
High-value widgets for contractor dashboards:
- Job board: Live grid of all open jobs by status (assigned, in progress, overdue, completed), technician, and site. The primary tool for dispatchers managing daily schedules.
- PM compliance heatmap: Color-coded view of PM completion rates by asset class or site. Red cells identify where missed PMs are accumulating before they cause failures.
- Technician utilization gauge: Real-time percentage of billable hours versus available hours per technician. Identifies crews with capacity to absorb additional work.
- Job-level margin tile: Revenue minus actual costs per job, updated as labor and parts are logged. The earliest warning signal for a job trending over budget.
- Inventory days-on-hand: Current stock level divided by average daily consumption for critical parts. Prevents the emergency procurement that inflates job costs and delays completion.
Three scenarios where dashboards change outcomes:
Reducing emergency service calls: A multi-site building services contractor notices through the PM compliance heatmap that HVAC filter replacements at three locations are consistently running two weeks late. Adjusting the PM schedule and adding a parts pre-staging step eliminates the pattern of reactive calls that were costing the company in overtime labor.

Optimizing labor sourcing: A maintenance manager uses the job-level margin tile alongside the contractor vs. internal labor cost breakdown to identify that subcontracted electrical work on a specific contract type consistently erodes margin. The data supports a business case for hiring one additional in-house electrician.
Preventing missed PMs that affect contracts: A contractor managing facility maintenance agreements uses PM compliance tracking to generate client-facing compliance reports automatically, reducing the manual effort of monthly reporting and providing documented proof of service delivery.
Pro Tip: Owners should open the dashboard to the job-level margin tile first, every morning. If three or more jobs are trending below target margin simultaneously, that is a scheduling or labor-sourcing problem that needs attention before end of week, not end of month.
For contractors managing multiple client assets across sites, the client asset management guide covers how to structure asset records so dashboard tiles stay accurate across accounts.
What does a realistic dashboard rollout look like for contractors?
Most contractors underestimate the time required for data cleanup and integrations and overestimate how long training takes once the data is reliable.
| Phase | Duration | Primary activities |
|---|---|---|
| Plan and design | 2–4 weeks | Stakeholder interviews, KPI selection, data source mapping, role-based view design |
| Integrations and pilot | 4–8 weeks | CMMS and ERP connections, telematics setup, data cleanup, single-site pilot |
| Full rollout and training | 2–4 weeks | Multi-site deployment, field technician training, alert configuration, iteration |
Main cost drivers:
- Licensing model: SaaS seat-based pricing scales with team size; per-site models suit contractors with a small number of large facilities.
- Integrations and middleware: Connecting CMMS to ERP and telematics often requires API configuration or middleware tools, which can represent a significant portion of implementation effort.
- Telematics hardware: GPS and engine-hour sensors for equipment not already instrumented add upfront hardware cost.
- Data cleanup: Historical work order and asset data often contains duplicates, missing fields, or inconsistent naming that must be resolved before dashboard tiles produce reliable numbers.
- Training and change management: Field technician adoption is typically the fastest part of rollout when the mobile interface is intuitive; resistance usually comes from supervisors who relied on manual spreadsheets.
Early ROI measures to track during the pilot:
- Reduction in emergency or unplanned maintenance hours per week
- PM compliance rate improvement from baseline
- Reduction in time from job completion to invoice generation
- Decrease in parts emergency procurement events
Realistic time-to-value for most contractors is a few months from go-live on the pilot site, assuming clean data and a committed data owner for each integrated system. Compliance-focused contractors can find additional implementation guidance in the compliance tracking guide.
Key Takeaways
A maintenance service dashboard gives contractors real-time visibility into operations and job-level financials, turning field data into decisions that protect margins and prevent missed PMs.
| Point | Details |
|---|---|
| Core definition | A contractor dashboard consolidates CMMS, telematics, and financial data into real-time KPI tiles with drill-down access to source records. |
| Top KPIs to track | PM compliance, technician utilization, job-level margin, MTTR, and open/overdue jobs are the five metrics that most directly affect contract profitability. |
| First dashboard to build | Start with a CMMS operations view limited to 6–8 KPIs for one role; expand after the pilot proves data reliability. |
| Required integrations | Connect CMMS, ERP or accounting, telematics, inventory, and mobile app before go-live to prevent data drift and manual entry errors. |
| MPulse Software | MPulse CMMS maps directly to these dashboard needs with preventive maintenance automation, real-time monitoring, IIoT integration, and mobile access for field teams. |
The dashboard gap most contractors don’t see until it’s too late
The conversation around maintenance dashboards tends to focus on what to display. The harder problem, and the one that actually determines whether a dashboard changes behavior, is what to do when the data contradicts what your team believes.
Most contractors who struggle with dashboard adoption aren’t failing because they chose the wrong software. They’re failing because the dashboard surfaces an uncomfortable truth: PM compliance is lower than the maintenance manager thought, job margins are thinner than the owner assumed, or technician utilization is uneven in ways that reflect scheduling decisions, not workload. When the data challenges existing assumptions, the instinct is often to question the data rather than the process.
The contractors who get real value from a service management dashboard are the ones who treat the first 30 days of a pilot as a calibration exercise, not a validation exercise. They expect the numbers to look wrong at first. They use that period to fix data ownership, close integration gaps, and build the habit of acting on what the dashboard shows rather than what they expected it to show.
The other underappreciated pitfall is role-specific design. A single dashboard trying to serve owners, maintenance managers, and dispatchers simultaneously ends up serving none of them well. Owners need margin signals. Managers need PM compliance and downtime. Dispatchers need the job board. Build three views, not one, and adoption follows naturally because each user sees only what they need to act on.
MPulse Software: built for the KPIs that matter to contractors
Contractors who need a CMMS that maps directly to the dashboard capabilities described here should look at MPulse Software. The platform combines preventive maintenance automation with real-time performance monitoring, giving maintenance managers the PM compliance tracking, technician utilization data, and work order visibility that operational dashboards require.
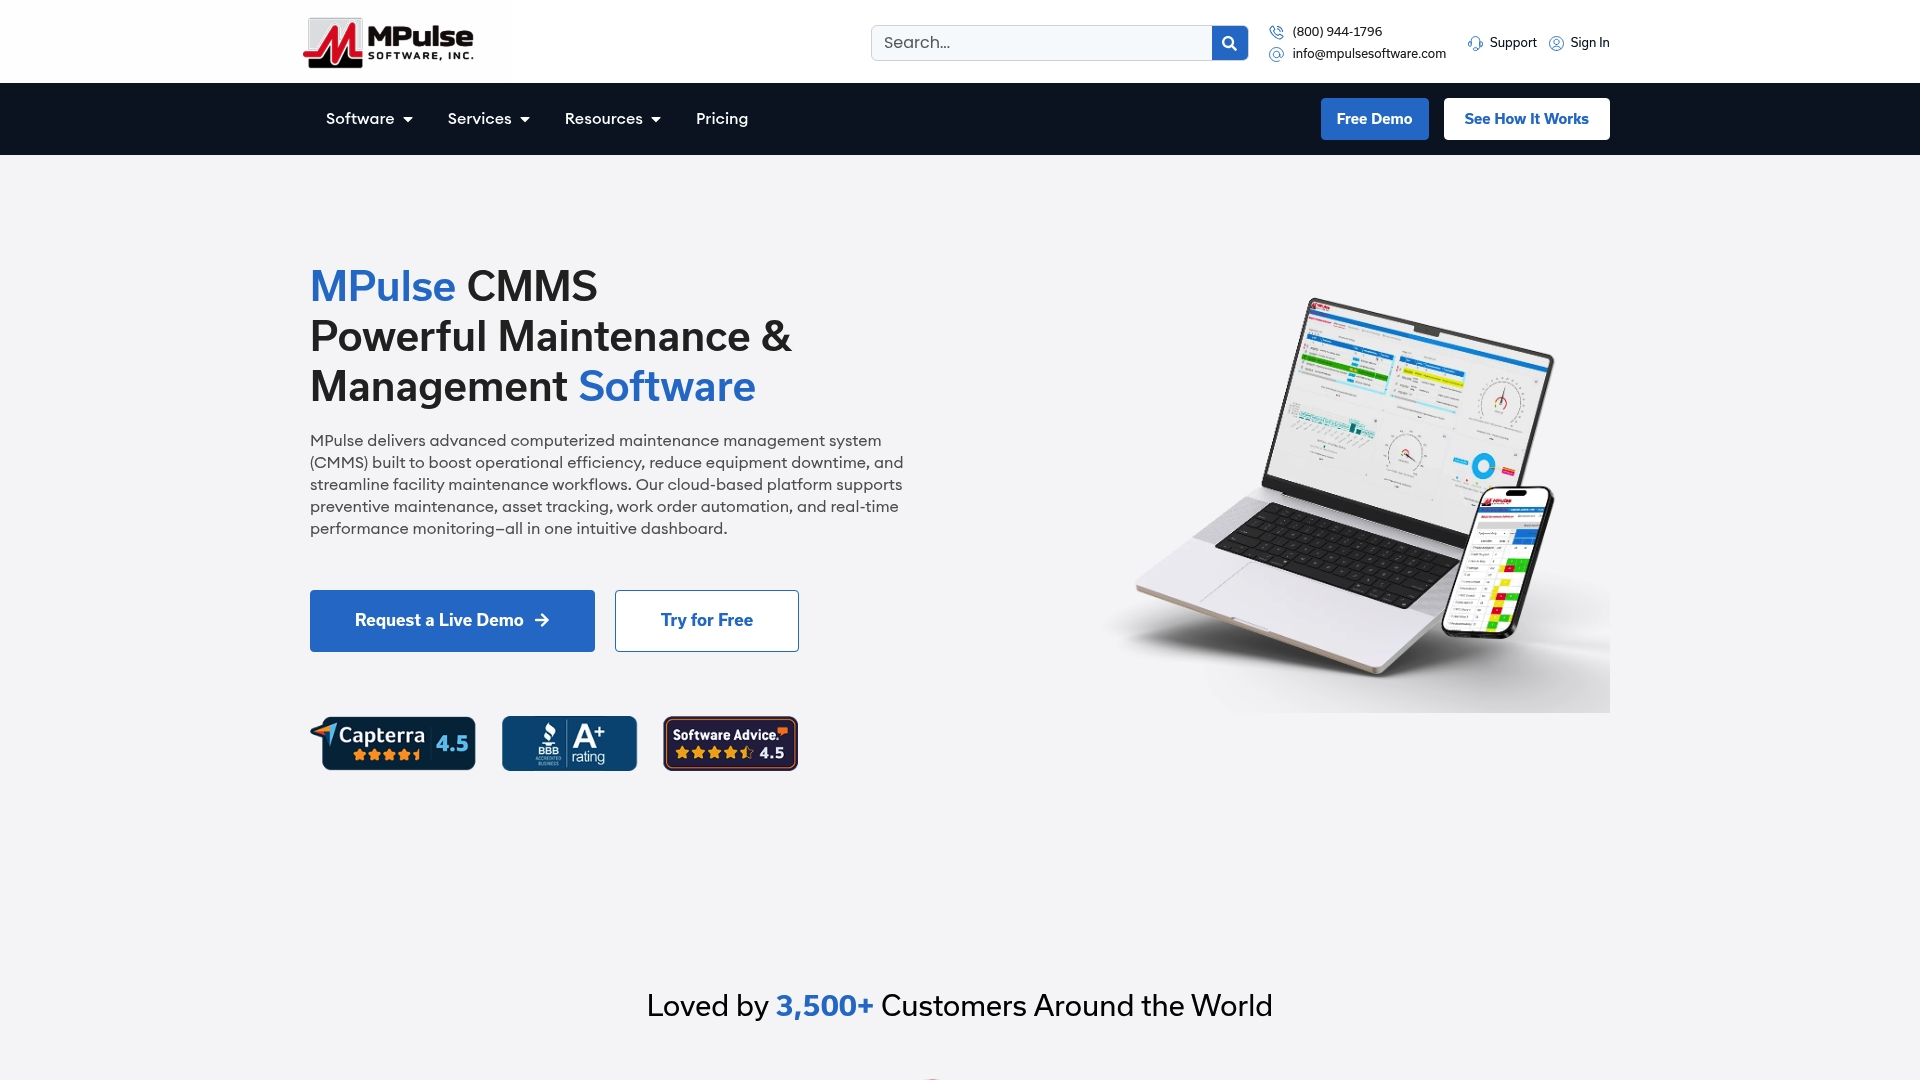
MPulse’s IIoT and real-time monitoring capabilities connect sensor and telematics data directly to the CMMS, eliminating the manual engine-hour entries that cause data drift. The resource planning dashboard gives dispatchers and operations managers a live view of crew capacity and job assignments. For contractors in compliance-heavy industries, MPulse supports regulatory recordkeeping and audit-ready reporting alongside daily operational visibility. Thousands of customers rely on MPulse, with documented efficiency improvements reported. To see how MPulse maps to your specific KPIs and integration requirements, request a demo or explore the platform’s full feature set.
Useful sources and further reading
Resources for contractors planning or implementing a maintenance service dashboard:
- Facility Maintenance KPIs to Track in CMMS — Start here for KPI definitions and what to display on operational vs. executive views.
- Key Performance Indicators for Maintenance — Detailed formulas and benchmarks for MTTR, MTBF, PM compliance, and technician utilization.
- Tips for Setting Up Your CMMS Dashboard — Practical tile configuration and role-based access setup for contractors new to CMMS dashboards.
- Real-Time Monitoring with CMMS — Background on moving from static reports to live dashboards and what integrations enable it.
- Compliance Tracking for Maintenance Contractors — Full guide to using dashboards for regulatory compliance and contract audit readiness.
- Mobile CMMS for Field Technicians — Practical guidance on mobile adoption and preventing data drift from manual field entry.
- Contractor Maintenance Scheduling Strategies — Scheduling approaches that reduce downtime and support dashboard-driven PM compliance.
- Tracking the True Cost of Maintenance — Explains job-level margin and cost-of-labor metrics and how to surface them on a dashboard.
- Datalink Integration Adapter for CMMS — Details on MPulse’s integration options for connecting ERP, telematics, and inventory systems.
- Maintenance KPI Dashboard: Effective Performance Tracking — Industry overview of dashboard design principles and real-time monitoring benefits.
FAQ
What is a maintenance service dashboard for contractors?
A maintenance service dashboard is a real-time visual display that consolidates work orders, asset health, PM compliance, technician utilization, and financial metrics into a single interactive interface. Contractors use it to monitor operations and make scheduling and sourcing decisions without waiting for weekly or monthly reports.
What are the key performance indicators for maintenance?
The five most critical maintenance KPIs for contractors are PM compliance, MTTR, MTBF, technician utilization, and job-level margin. PM compliance is calculated as completed PMs divided by scheduled PMs multiplied by 100; a rate below 85% typically signals scheduling or parts problems.
What are the main types of maintenance dashboards?
The four most common types are CMMS operations dashboards (work orders and PM schedules), asset health dashboards (equipment condition and failure history), inventory and parts dashboards (stock levels and reorder status), and field operations dashboards (job board, technician location, and dispatch visibility). Predictive dashboards that use sensor data to forecast failures represent a fifth type suited to contractors with high-value equipment.
How is a dashboard different from a maintenance report?
A dashboard displays real-time data and supports drill-downs so teams can act immediately; a maintenance report is a static historical document used for audits, compliance submissions, and financial reconciliation. Both are necessary: dashboards drive daily operations, reports support billing cycles and contract reviews.
Can MPulse Software support contractor dashboard needs?
MPulse Software provides preventive maintenance automation, real-time monitoring, IIoT integration, and mobile access that map directly to the KPIs and integration requirements described in this guide. The platform’s resource planning dashboard and work order management capabilities give contractors the operational and financial visibility needed to run a contractor service dashboard effectively.