

Graphical CMMS reporting makes it easy to quickly produce status reports and documents giving details or summaries of your team’s maintenance work. As a result, you can communicate with different departments in your organization and show your team’s impact on operations.
Simple CMMS Reporting
You can create simple, easy-to-read graphic reports with just a few clicks in MPulse Software. Our reporting features enable you to…
- Select from over 300 pre-configured text and graphical reports
- Easily build your own reports in the MPulse Report Builder
- Customize your reports or create graphical views
- Produce status reports and documents giving details or summaries of your team’s maintenance work
- Create benchmarks for your organization
- Get quick access to the numbers you need to make important decisions.
Start by checking out the Report Widgets in MPulse. Note that you can narrow down the widgets by choosing the type of report you want to create. For example, we’re looking only at the Financial Widgets in the image below.
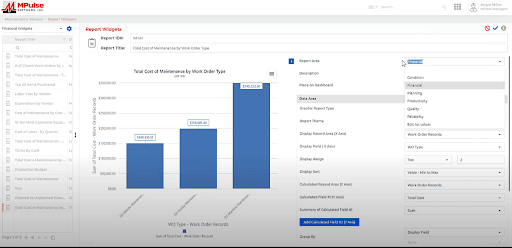
- Edit all the parameters on the right side of the screen. For example, you might want a pie chart instead of a bar chart. You also can choose the data you want to build the report on.
- To save your report, simply click the Save button at the top right corner of the screen.
- Also check the Add to Dashboard box if you want the report to display on your personal dashboard. That’s it! Couldn’t be easier.
Those reports give you a quick visualization of the numbers you need to make important decisions. These reports also help explain the value of maintenance to other departments and managers in your organization.
What Questions Can CMMS Reports Answer
At a glance, graphical CMMS reports can show how much money each work order type is costing your business in maintenance for a specified timeframe. This data can be applied directly to purchasing or other important organizational decisions. You’ll be able to purchase, operate, maintain, upgrade, or dispose of assets in the most cost-effective manner.
Common questions can be quickly answered.
- What type of maintenance do I spend the most on?
- How does the cost of preventive maintenance compare to repair costs?
- If I run this report for a different time period, like last year, are there significant changes by category?
Beyond those general questions, you can ask precise questions that’ll lead to a more informed decision-making process.
- Why are my machining maintenance costs so high?
- What new equipment needs to be purchased, if any?
- How much will the new equipment cost compared to the current maintenance expense?
- Will I save money over time by purchasing new equipment? How much?
How to Create Graphical Reports with MPulse
MPulse makes answering questions easy with Report Widgets. You can customize these widgets to meet your needs.
- Start by selecting the closest report under Report Widgets. That gives you a good starting point to build your report.
- Edit the report to include the data you need and the time period you want. You also can add custom information to the Description field.
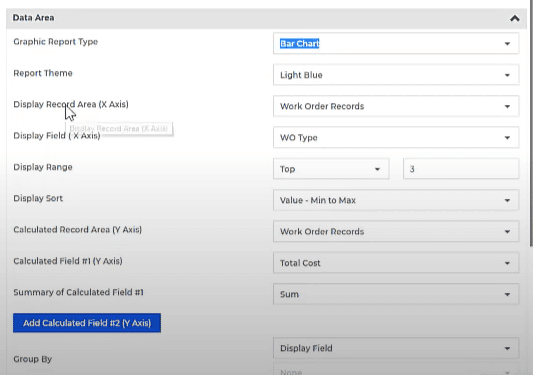
Next, you have several choices for customizing a facility maintenance report, equipment maintenance report, financial report, etc. in the Data Area section.
- Select the Graphic Report Type you want.
- Choose the Record Area and Field you want for the x-axis of your chart.
- Pick the Display Range and Display Sort.
- Enter the Calculated Area and Calculated Field you want for the y-axis of your chart.
- Choose the Summary of Calculated Field #1 for the type of summary data you want.
- If you want a second calculated field, click on Add Calculated Field (#2) and follow the same steps to set the parameters.
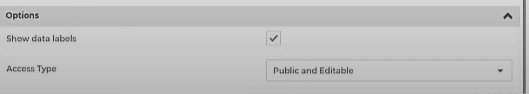
Finally, under Options, you can…
- Click Show data labels, if you want to display labels.
- Set the Access Type to control who can access or edit the report.
What CMMS Reports Do I Need?
Having hard numbers not only helps you run your business, it allows you to measure and use a whole host of key performance indicators. KPIs evaluate your success in the areas you care about, giving you a new level of insight on what’s going on in your department. Knowing KPIs for application support and maintenance is crucial to reaching your team’s goals.
Related: How to Find the Maintenance Reports You Need
Maintenance managers should concentrate on the KPIs that measure their goals. For example, maintenance KPIs that most MPulse customers find handy include…
- Planned Maintenance Percentage: the percentage of the total hours spent on PM maintenance activities over a specific period
- Preventative Maintenance Compliance (PMC): the percentage of scheduled PM tasks that get done in a specific time interval
- Mean Time to Repair (MTTR): the average time to evaluate and repair failed equipment
- Mean Time Between Failures (MTBF): the predicted time between failures of an asset during normal operation
- Overall Equipment Effectiveness (OEE): the percentage of manufacturing time that is truly productive
- Maintenance Backlog: the percentage of uncompleted tasks
A CMMS report enables you to transform your CMMS data into meaningful insights and make data-driven decisions by analyzing historical costs and trends. That includes the ability to accurately assess how your department is functioning and where you might make changes to improve.
If a picture is worth a thousand words, a CMMS report can be worth thousands of dollars. To learn more, contact us.
