
TL;DR:
- Maintenance data analytics helps transform signals into predictable equipment uptime and cost savings. It delivers significant operational improvements when data foundations are strong and predictive models are implemented carefully.
Maintenance data analytics matters because it converts equipment signals and work-order history into predictable uptime, measurable cost reductions, and defensible capital decisions. The case for investing is clear when two conditions are met: your assets are critical enough that unplanned failure carries real financial or safety consequences, and your data is retrievable enough to feed a model.
Here is what analytics delivers when those conditions hold:
- AI-driven predictive maintenance can substantially reduce unplanned maintenance events and improve equipment availability when implemented with a solid data foundation.
- Organizations that integrate predictive maintenance into capital planning report portfolio savings of 5–15% and maintenance expense reductions of 18–30%, according to Oxand’s analysis.
- Analytics delivers clear ROI on high-criticality assets with documented failure histories. On low-criticality assets with sparse data, the return is uncertain and the investment is often premature.
Table of Contents
- What maintenance data analytics actually covers
- The concrete business case: what analytics delivers
- Collecting and preparing the right data
- KPIs to track and benchmark for maintenance analytics
- Predictive maintenance and failure analysis: what works in practice
- How the technology stack fits together
- A practical starter plan: from readiness to pilot results
- Common pitfalls and how to avoid them
- Real-world outcomes: what teams have measured
- Key Takeaways
- The gap most teams miss when they start analytics programs
- MPulse Software turns maintenance data into scheduled action
- Further reading and sources
- FAQ
What maintenance data analytics actually covers
Maintenance data analytics is the practice of collecting, integrating, and analyzing data from equipment, work orders, and operational systems to improve maintenance decisions. The inputs range from CMMS records and sensor telemetry to PLC/SCADA logs and parts inventory transactions. The outputs range from dashboards showing schedule compliance to machine-learning models that flag impending failures days in advance.
A shared vocabulary helps when building the business case internally:
- CMMS (Computerized Maintenance Management System): the system of record for assets, work orders, and maintenance history.
- IIoT (Industrial Internet of Things): the network of sensors and connected devices that stream real-time equipment data.
- CBM (Condition-Based Maintenance): maintenance triggered by measured equipment condition rather than a fixed schedule.
- PdM (Predictive Maintenance): analytics-driven forecasting of when a failure will occur, enabling intervention before it happens.
- RUL (Remaining Useful Life): an estimate of how much service life an asset has left, derived from degradation models.
- MTTR (Mean Time to Repair): average time to restore an asset after a failure.
- MTBF (Mean Time Between Failures): average operating time between failures, a core reliability indicator.
- OEE (Overall Equipment Effectiveness): a composite measure of availability, performance, and quality.
A CMMS is not just a work-order tool. When configured with consistent asset IDs, complete failure codes, and timestamped labor records, it becomes the primary data source for every analytics layer above it.
Analytics sits at the top of a layered stack. The CMMS holds the asset master and work-order history. IIoT sensors add real-time condition data. An analytics engine or dashboard layer processes both. MPulse CMMS is built to serve that foundational role, with analytics-ready exports, integration endpoints, and graphical reporting that feed directly into the layers above.
Pro Tip: Before evaluating any analytics platform, audit your CMMS data completeness first. If asset IDs are inconsistent or failure codes are missing, no analytics tool will compensate for that gap.
The concrete business case: what analytics delivers
The financial and operational benefits of maintenance analytics fall into four categories that map directly to KPIs your leadership team already tracks.
- Unplanned downtime reduction. Predictive and condition-based models catch degradation before failure, cutting emergency repairs and the production losses that accompany them.
- Maintenance cost savings. Shifting from reactive to planned work reduces overtime, expedited parts orders, and secondary damage. Maintenance cost reductions of 18–30% are reported when PdM informs investment planning, with typical portfolio savings in the 5–15% range.
- Asset life extension. Treating equipment at the right time, rather than too early or too late, extends service life and defers capital replacement.
- Improved service levels and SLA compliance. Scheduled maintenance driven by real condition data keeps assets available when operations need them, supporting SLA commitments and customer-facing uptime guarantees.
Statistic to use in your business case: AI-supported predictive maintenance reduces unplanned maintenance by 35–50% and improves equipment availability by 15–25% when the underlying data foundation is solid.
The workforce efficiency gains are equally significant. Planners spend less time firefighting and more time on scheduled work. Technicians arrive with the right parts because analytics-driven work orders include parts predictions. Inventory carrying costs drop as spare-parts purchasing shifts from reactive to planned.
Collecting and preparing the right data
Analytics is only as reliable as the data feeding it. Before running a single model, you need to know what data you have, where it lives, and whether it is clean enough to use.
Primary data sources to consolidate:
- CMMS/EAM records: asset hierarchy, work-order history, failure codes, labor hours, parts consumed.
- IIoT sensors: vibration, temperature, pressure, current draw, flow rate.
- PLC/SCADA logs: process parameters and equipment state transitions.
- Work-order notes: technician observations that often contain early failure signals not captured in structured fields.
- Parts and inventory systems: consumption patterns that correlate with failure rates.
- Vendor records: OEM failure data and recommended inspection intervals.
Oxand’s framework identifies three non-negotiable layers for any analytics program: a consolidated historical asset baseline, integrated real-time operational data, and universal data standards. Skipping any layer undermines the value of the layers above it.
Poor data governance does not just slow analytics projects — it actively produces wrong answers. A model trained on inconsistent asset IDs or missing failure codes will generate recommendations that erode technician trust faster than any change-management program can rebuild it.
Data-readiness checklist before launching a pilot:
- Sensor coverage confirmed on pilot assets.
- At least 12–24 months of retrievable failure and maintenance history.
- Consistent asset taxonomy and unique asset IDs across all source systems.
- Timestamps validated and time zones standardized.
- Failure codes populated and mapped to a standard taxonomy.
Pro Tip: The fastest data-quality win is usually fixing asset IDs. Run a deduplication pass on your CMMS asset registry before touching sensor data or analytics models.
Maintaining clean, governed datasets reduces time spent on manual fixes and directly improves the speed and reliability of decisions downstream.

KPIs to track and benchmark for maintenance analytics
| KPI | Formula | Primary data source | Benchmark (heavy industry) |
|---|---|---|---|
| MTTR | Total repair time ÷ number of failures | CMMS work orders | 2–4 hours (rotating equipment) |
| MTBF | Total operating time ÷ number of failures | CMMS + IIoT uptime logs | — |
| Unplanned downtime % | Unplanned downtime hours ÷ total available hours | CMMS + production system | Below 5% |
| Schedule compliance | Completed PMs on time ÷ total PMs scheduled | CMMS PM records | — |
| OEE | Availability × Performance × Quality | CMMS + MES/SCADA | — |
| Maintenance cost per unit | Total maintenance spend ÷ units produced | CMMS + ERP | Varies by industry |
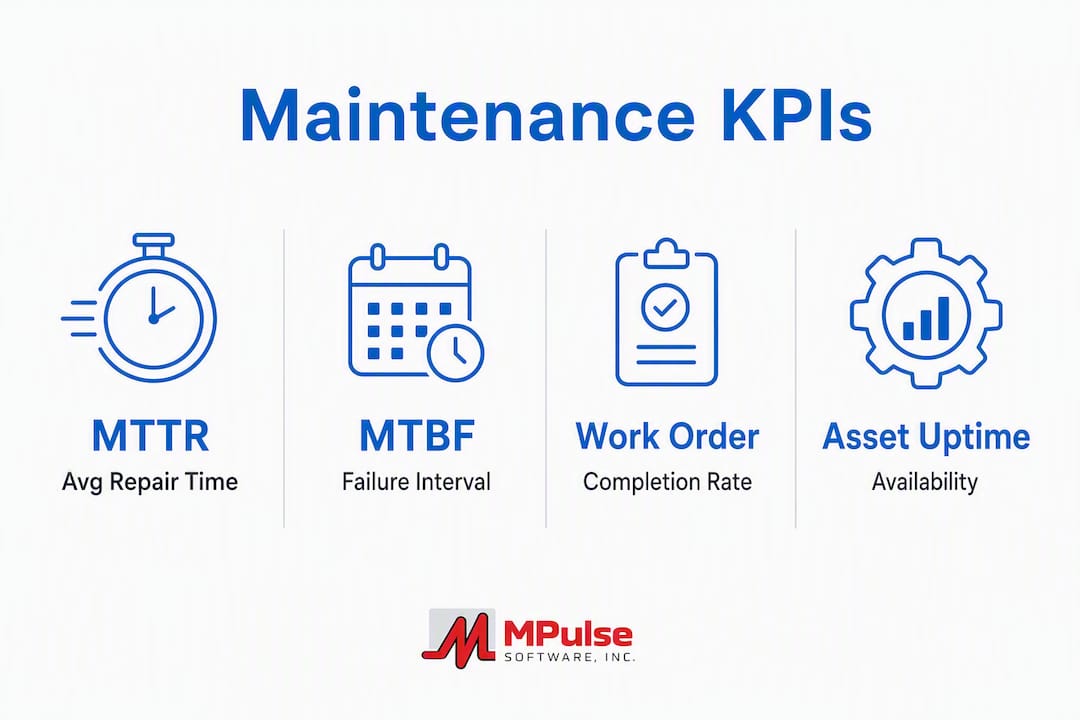
Measuring these KPIs reliably requires that your CMMS captures failure timestamps, labor hours, and parts costs consistently. Without that discipline, the formulas produce noise rather than signal. Start with MTTR and unplanned downtime percentage — they are the easiest to extract from most CMMS systems and the most persuasive metrics for executive audiences.
Predictive maintenance and failure analysis: what works in practice
PdM, CBM, and advanced troubleshooting (ATS) are not interchangeable. They differ in complexity, data requirements, and expected return.
- CBM monitors a condition parameter (vibration amplitude, oil viscosity, temperature) and triggers maintenance when a threshold is crossed. It requires sensors and alert rules but no machine-learning model.
- PdM uses statistical or ML models to forecast when failure will occur, enabling earlier intervention and better parts planning. It requires substantial historical failure data and ongoing model maintenance.
- ATS uses repair analytics and telemetry to diagnose root causes remotely, reducing truck rolls and enabling remote resolution. McKinsey’s analysis shows this approach can shift a high percentage of fixes from field visits to remote resolution.
Three rules for selecting assets for PdM investment:
- The asset is critical: its failure causes production loss, safety risk, or regulatory exposure.
- Sensor data is available or can be installed cost-effectively.
- The asset has a documented failure history suitable for modeling.
Statistic: McKinsey identifies data availability, capabilities, and economic return as the primary barriers to scaling PdM — meaning most organizations are not ready for full PdM deployment on day one.
False positives are a real financial risk. A model that generates unnecessary work orders erodes technician trust and offsets savings. McKinsey recommends prioritizing CBM and ATS where PdM complexity or false-positive risk is high. For most organizations, CBM and ATS are the faster path to self-funding wins that build the data maturity needed for PdM later. See also: when your organization may not need PdM yet.
How the technology stack fits together
The architecture for maintenance analytics has four layers, each dependent on the one below it.

Layer 1 — Asset registry and work management (CMMS). This is the foundation. Every asset, its maintenance history, and every work order lives here. Without a clean asset master, the layers above cannot function reliably.
Layer 2 — Telemetry ingestion (IIoT gateways, PLC/SCADA). Sensors stream condition data into a collection layer. Latency requirements vary: vibration monitoring for rotating equipment may need near-real-time ingestion; temperature trending for HVAC can tolerate 15-minute intervals.
Layer 3 — Data storage and processing (data lake or historian). Raw telemetry and CMMS exports land here, are cleaned, and are made available to analytics models. This layer is where data standards matter most.
Layer 4 — Analytics models and dashboards. Models generate alerts or RUL estimates. Dashboards surface KPIs. Critically, alerts must feed back into the CMMS as work orders, or they will not be acted on consistently.
The most common failure point in analytics programs is the gap between Layer 4 and Layer 1. An alert that sits in a dashboard without triggering a work order is an alert that gets ignored.
MPulse CMMS supports IIoT integration and real-time monitoring, connecting sensor data directly to work-order automation so that condition alerts translate into scheduled field actions rather than dashboard noise. McKinsey’s guidance reinforces this: PdM alarms must link to work orders, and results must feed back to PdM teams to improve models continuously.
Pro Tip: When evaluating analytics platforms, ask specifically how alerts create work orders and how work-order outcomes feed back to the model. A platform that cannot close that loop will plateau quickly.
A practical starter plan: from readiness to pilot results
McKinsey advises starting small with less complex models and treating analytics as an ongoing organizational transformation, not a one-time IT project. A phased pilot approach reflects that reality.
- Conduct a data-readiness assessment (weeks 1–4). Audit CMMS completeness, sensor coverage, and historical data retrievability on candidate assets. Use the checklist in the data collection section above.
- Select two to four pilot assets (week 4). Choose assets that are critical, have sensor coverage, and have at least 12 months of failure history. Avoid the most complex assets for the first pilot.
- Clean and standardize data (weeks 4–8). Fix asset IDs, populate missing failure codes, and validate timestamps. This step takes longer than most teams expect.
- Deploy CBM rules or a simple threshold model (weeks 8–12). Start with condition-based rules before committing to ML models. Threshold-based CBM is faster to validate and easier to explain to technicians.
- Integrate alerts with work orders (weeks 12–16). Configure your CMMS so that condition alerts automatically generate work orders with the right priority, asset, and parts list.
- Measure outcomes against baseline KPIs (weeks 16–36). Track MTTR, unplanned downtime percentage, and schedule compliance against the pre-pilot baseline. A 3–9 month pilot window gives enough data to make a credible scale-up case.
Roles required: a reliability engineer to own asset selection and model validation, an IT or OT engineer to manage data pipelines, and a CMMS administrator to configure work-order automation. For organizations without in-house data engineering capacity, MDPI research confirms that analytical pathways using a small number of parameters can still produce ROI estimates, making phased adoption viable even for smaller operations.
Cost considerations: pilot costs vary by sensor infrastructure needs and CMMS configuration complexity. The clearest ROI signal comes from comparing the cost per reactive work order before and after the pilot against the cost of the analytics investment.
Common pitfalls and how to avoid them
Most analytics programs that fail do so for predictable reasons. Knowing them in advance is the mitigation.
Technical risks:
- Sparse sensor coverage on pilot assets forces models to rely on proxy variables, reducing accuracy.
- Inconsistent asset taxonomy across CMMS and IIoT systems creates join errors that corrupt analysis.
- Missing historical failure data means models have too few events to train on reliably.
Organizational risks:
- No designated owner for analytics outcomes means alerts get ignored and models degrade.
- Field workflows are not updated to reflect analytics-driven work orders, so technicians revert to familiar patterns.
- Incentives remain tied to reactive response speed rather than prevention, creating a structural mismatch.
Analytics programs fail organizationally more often than they fail technically. A governance structure that assigns ownership, ties KPIs to outcomes, and creates a feedback loop between field results and model updates is what separates programs that scale from programs that stall.
Security and privacy checklist for IIoT telemetry:
- Segment OT networks from IT networks before connecting sensors to analytics platforms.
- Encrypt telemetry in transit and at rest.
- Define data retention policies and access controls before ingestion begins.
- Audit third-party vendor access to telemetry data.
Pro Tip: Assign a named owner for every analytics alert category before go-live. “Someone will handle it” is not a workflow. Define who receives the alert, what action they take, and how the outcome gets recorded in the CMMS.
For a deeper look at predictive maintenance challenges and mitigation strategies, MPulse Software’s resource library covers the most common implementation failure modes.
Real-world outcomes: what teams have measured
The results from well-executed analytics programs are consistent across industries when the data foundation is solid.
Organizations integrating predictive maintenance into capital planning report portfolio savings of 5–15% and maintenance expense reductions of 18–30%, according to Oxand’s analysis. Those figures assume a mature data foundation and integration between PdM systems and work management.
Statistic: AI-driven predictive maintenance reduces unplanned maintenance by 35–50% and improves equipment availability by 15–25% in cases where sensor infrastructure and historical data are in place.
Remote troubleshooting through repair analytics and telemetry has shifted a significant share of fixes from field visits to remote resolution in documented cases, cutting truck rolls and parts consumption. The operational model changes: technicians handle more complex interventions while remote diagnostics resolve simpler faults without a site visit.
Where PdM has struggled, the pattern is consistent: insufficient historical failure data, assets with irregular or unpredictable failure modes, and programs that deployed ML models before validating sensor coverage. The strongest results come from industrial rotating equipment with high failure event frequency and long operational histories.
Key Takeaways
Maintenance data analytics delivers measurable uptime and cost improvements when organizations build the data foundation first, start with condition-based models, and integrate alerts directly into work-order workflows.
| Point | Details |
|---|---|
| Build the data foundation first | Clean asset IDs, consistent failure codes, and 12–24 months of history are prerequisites before any analytics model. |
| Start with CBM before PdM | Condition-based rules deliver faster wins and build the data maturity needed for predictive models. |
| Close the alert-to-work-order loop | Analytics alerts that do not generate work orders are not acted on consistently and erode program value. |
| Measure MTTR and unplanned downtime first | These two KPIs are easiest to extract from CMMS data and most persuasive for executive audiences. |
| MPulse Software as the foundation | MPulse CMMS provides the asset master, work-order automation, and IIoT integration needed to support each analytics layer. |
The gap most teams miss when they start analytics programs
The conventional wisdom says the hard part of maintenance analytics is the technology. In practice, the technology is the easy part. The hard part is organizational: getting field technicians to trust model outputs, getting planners to act on alerts before failures occur, and getting leadership to measure prevention rather than response speed.
Most teams that struggle with analytics adoption have the same pattern: they invest in sensors and dashboards before fixing their CMMS data, then wonder why the models produce unreliable results. The sequence matters. A CMMS with clean asset records and complete work-order history is worth more to an analytics program than a sophisticated ML platform sitting on top of inconsistent data.
The other underestimated factor is the cost of false positives. A model that sends technicians to inspect equipment that turns out to be fine will be ignored within weeks. Measuring the economic cost of unnecessary interventions, not just model accuracy, is what separates programs that earn technician trust from programs that get quietly abandoned.
My recommendation for maintenance managers deciding between immediate PdM investment and CBM first: start with CBM on your two or three most critical assets, measure the outcomes rigorously, and use those results to build the internal case for PdM. Self-funding wins are more persuasive than any vendor ROI calculator.
MPulse Software turns maintenance data into scheduled action
The gap between a condition alert and a completed work order is where most analytics programs lose value. MPulse Software closes that gap directly. Its asset master provides the clean foundation analytics models require, while its preventive maintenance automation converts condition triggers and scheduled intervals into work orders without manual intervention.
MPulse’s IIoT integration connects sensor telemetry to work-order creation, so alerts from the field reach the right technician with the right parts list attached. Graphical reporting and analytics-ready exports mean your pilot KPIs, MTTR, unplanned downtime percentage, and schedule compliance are measurable from day one rather than after months of custom development. Over 3,500 customers rely on MPulse, with documented efficiency improvements of up to 40%.
If you are ready to move from reactive maintenance to a data-driven program, explore MPulse CMMS to see how the platform maps to each step of the implementation plan above. For organizations evaluating preventive maintenance contracts alongside software, MPulse integrates with managed service providers to give you a complete picture of scheduled and condition-driven work.
Further reading and sources
These sources support the claims in this article and provide the depth technical teams and decision-makers need when building an internal business case.
- Prediction at scale: How industry can get more value out of maintenance — McKinsey analysis on scaling PdM, covering data availability barriers and the importance of linking alarms to work orders. Supports sections on predictive maintenance and the starter plan.
- Establishing the right analytics-based maintenance strategy — McKinsey guidance on CBM vs. PdM selection, false-positive costs, and treating analytics as organizational transformation. Supports the PdM explainer and challenges sections.
Use these sources when presenting the business case to leadership or when scoping vendor requirements with your IT and OT teams.
FAQ
Why does maintenance data quality matter so much?
Poor data quality produces unreliable model outputs, erodes technician trust, and can generate false alerts that cost more to investigate than the failures they were meant to prevent. Clean, governed data is the prerequisite for any analytics program delivering consistent value.
What are the 4 pillars of data analytics in maintenance?
The four pillars are descriptive analytics (what happened), diagnostic analytics (why it happened), predictive analytics (what will happen), and prescriptive analytics (what to do about it). Each layer builds on the data quality and infrastructure established by the one before it.
When does predictive maintenance deliver clear ROI?
PdM delivers clear ROI on high-criticality assets with documented failure histories, adequate sensor coverage, and integration between the analytics system and work-order management. On low-criticality assets with sparse data, condition-based maintenance is usually the better starting point.
How does a CMMS support maintenance analytics?
A CMMS provides the asset master, work-order history, and failure records that analytics models depend on. Platforms like MPulse Software add IIoT integration and analytics-ready reporting, so condition alerts automatically generate work orders rather than sitting unactioned in a dashboard.
How long does a maintenance analytics pilot typically take?
A well-scoped pilot, from data-readiness assessment through measurable outcome reporting, typically runs 3–9 months. The longest phase is usually data cleanup and standardization, not model deployment.