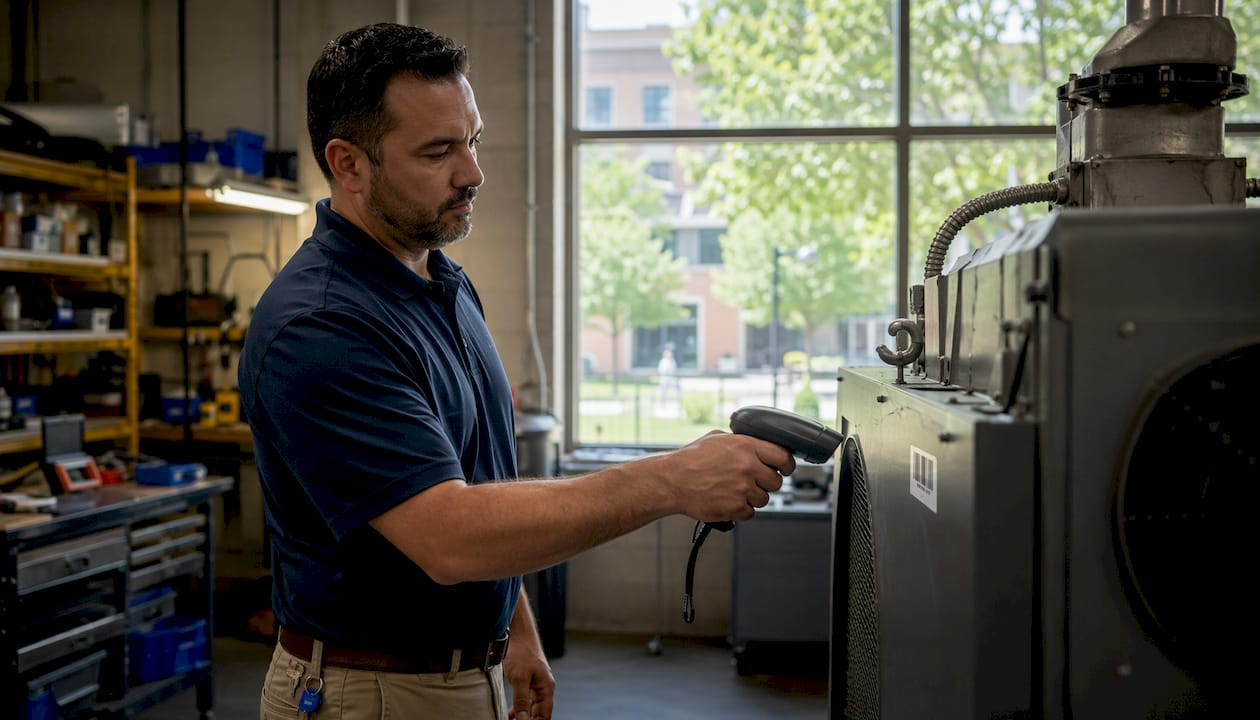
Aging school infrastructure increases costs because deferred maintenance, obsolete building systems, and a chronic underfunding cycle compound into higher operating expenses, emergency repair premiums, and sudden capital outlays. The national K–12 facilities shortfall approaches $90 billion, and per-student capital and maintenance spending runs below recommended benchmarks. Every dollar of maintenance deferred today tends to return as several times more in future costs, and in cases where secondary damage occurs, that multiplier can be much higher. APPA benchmarks show preventive maintenance can generate significant avoided costs for every dollar invested.
The core drivers break down into five compounding layers:
- Inefficient systems: Aging HVAC, lighting, and controls consume more energy than modern equivalents, raising utility costs year over year.
- Deferred maintenance debt: Each postponed repair grows in cost through deterioration, secondary damage, and emergency-rate labor.
- Capital funding gaps: Districts spending below recommended levels accumulate a backlog that eventually forces expensive modernization projects instead of routine replacements.
- Health, safety, and liability exposure: Indoor air quality failures, asbestos, lead, and code deficiencies trigger remediation and legal costs that dwarf the original repair.
- Operational disruption: System failures pull staff time, displace students, and cost districts state aid tied to instructional days.
Understanding these mechanisms gives facility managers and administrators the financial language to present deferred maintenance not as a maintenance problem but as an unscheduled debt instrument—the frame that moves boards.
Table of Contents
- How old systems drive up your day-to-day operating costs
- Why deferred maintenance turns small repairs into large liabilities
- How aging buildings create health, safety, and liability costs
- How capital funding gaps inflate total public-sector costs over time
- Actionable steps to reduce cost escalation starting now
- Evidence that supports the economic case for maintenance discipline
- Key Takeaways
- The real cost of waiting
- How MPulse Software helps districts reduce facilities cost escalation
- Useful sources for building your evidence pack
- FAQ
How old systems drive up your day-to-day operating costs
Degraded building systems are the most visible and measurable source of cost escalation in aging schools. HVAC equipment operating past its design life loses efficiency steadily, and GAO field work confirmed HVAC deficiencies in about half of the school facilities visited, including cases where original boilers remained in service long after their rated lifespan. An oversized or undersized system that no longer matches a building’s thermal load runs longer cycles, consumes more fuel or electricity, and fails more often.
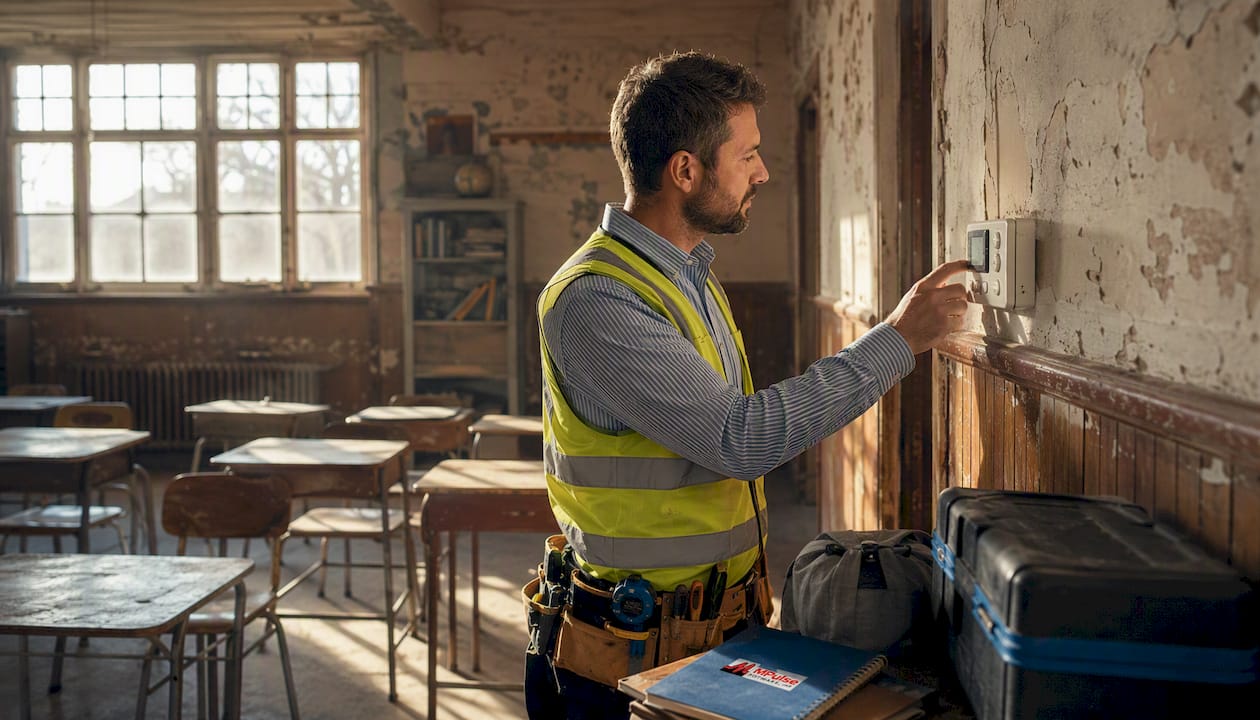
Lighting is a parallel drain. Schools still running T12 fluorescent fixtures or metal halide gymnasium lighting consume two to three times the electricity of LED equivalents, with no corresponding improvement in light quality or student comfort. Outdated building controls compound both problems: pneumatic thermostats and manual scheduling cannot respond to occupancy changes, so systems condition empty classrooms and gymnasiums at full load.
| System | Typical efficiency loss in aging buildings | Estimated savings from upgrade |
|---|---|---|
| HVAC (end-of-life equipment) | 20–40% above baseline energy use | 15–30% reduction post-replacement |
| Lighting (T12/metal halide to LED) | 50% higher wattage for same output | 40–60% energy reduction |
| Building automation / controls | 10–20% waste from poor scheduling | 10–15% reduction with modern BAS |
| Plumbing / water fixtures | Elevated consumption from worn seals, aging fixtures | 20–30% reduction with low-flow upgrades |
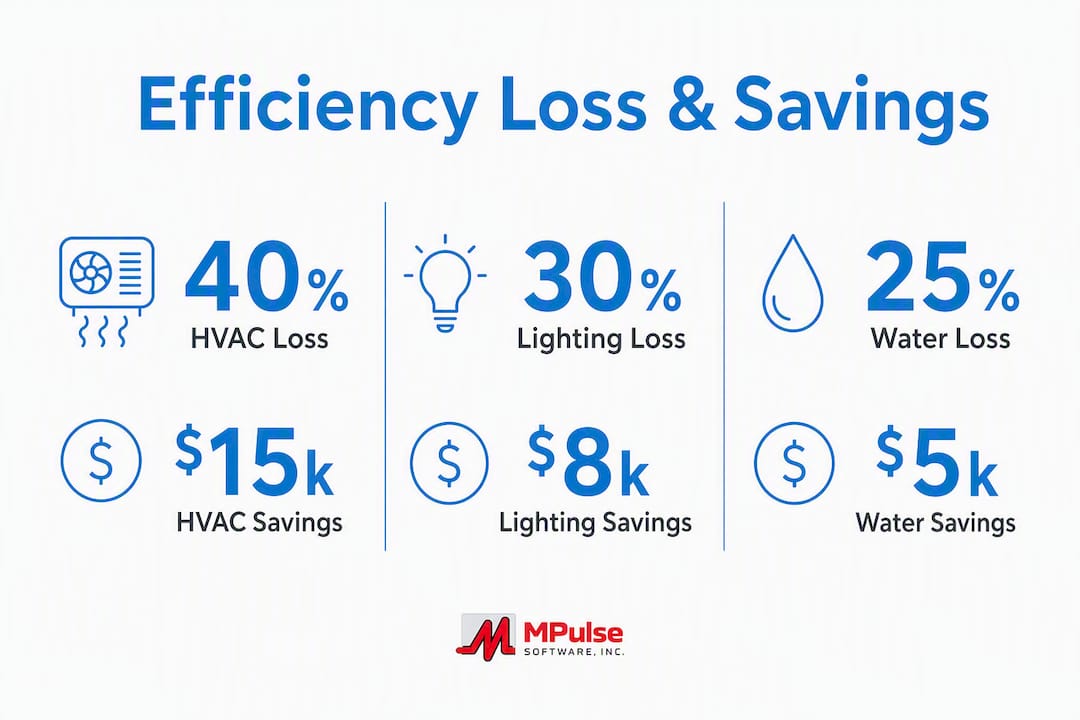
Water systems in older buildings carry similar inefficiencies. Worn valve seats, aging fixtures, and corroded distribution piping increase consumption and maintenance labor. Waste management costs also rise when loading docks, compactors, and utility connections are poorly configured for current volumes.

Pro Tip: Before committing to full system replacement, schedule a controls tune-up and recommissioning of existing HVAC equipment. Recommissioning typically recovers 5–15% of energy waste at a fraction of replacement cost and buys time for proper capital planning.
Why deferred maintenance turns small repairs into large liabilities
Deferred maintenance compounds through three distinct mechanisms: the original item continues to deteriorate, adjacent systems absorb secondary damage, and any eventual repair is completed at emergency rates rather than planned-project rates. A roof leak deferred for two seasons does not simply cost more to patch — it saturates insulation, promotes mold growth, damages ceiling tiles and structural decking, and may require temporary classroom relocation during remediation.
The math is concrete. One documented case shows a $50,000 planned replacement that ultimately produced $226,000 in emergency and remediation costs after the failure cascaded into secondary damage. That is a 4.5x multiplier on a single deferred item. Across a district portfolio, the aggregate effect is a maintenance backlog that grows faster than annual budgets can address.
Parts obsolescence adds another layer of cost. When a chiller or boiler control board is no longer manufactured, technicians must source custom fabrications or accept full system replacement on an emergency timeline, at emergency pricing. Districts that have not tracked asset ages and replacement windows regularly face this scenario.
Common escalation pathways worth documenting for board presentations:
- Water infiltration: Deferred flashing repair → insulation saturation → mold growth → ceiling replacement → temporary space rental → lost instructional days.
- HVAC failure: Deferred coil cleaning → compressor failure → emergency replacement → custom crane access → premium labor rates.
- Electrical panel aging: Deferred panel upgrade → breaker failure → partial building shutdown → code-required full panel replacement at emergency rates.
- Plumbing corrosion: Deferred pipe lining → pinhole leaks → water damage to flooring and walls → potential lead-line remediation.
Pro Tip: Convert each deferred item into a “callable debt” slide for your CFO: show today’s planned-replacement cost, the projected cost if deferred 3–5 years (apply the 4x–6x multiplier), and the annual carrying cost of the risk. That framing shifts the conversation from maintenance budget to financial risk management.
How aging buildings create health, safety, and liability costs
Building condition directly affects student health, and student health directly affects district finances. The EPA links poor indoor air quality in schools to increased absenteeism, reduced concentration, and higher rates of asthma and respiratory illness. Districts lose state aid calculated on average daily attendance, so a persistent IAQ problem is simultaneously a health issue and a revenue loss.
Older buildings carry specific hazardous material risks that trigger mandatory remediation costs. Asbestos-containing materials in floor tiles, pipe insulation, and ceiling systems must be managed or abated under EPA and OSHA regulations whenever renovation or deterioration disturbs them. Lead-based paint in pre-1978 buildings and lead service lines in older plumbing systems require testing, disclosure, and remediation under federal and state requirements. Neither is optional, and both carry legal liability if ignored.
Aging school buildings in poor repair cannot meet modern teaching and learning needs. Inadequate buildings make improvements in standards of achievement more challenging — and the financial costs of that gap extend well beyond the maintenance budget.
Code and accessibility compliance adds a third cost category. A renovation triggered by a system failure often crosses the threshold that requires ADA upgrades, fire suppression retrofits, or egress improvements. What begins as a $30,000 mechanical repair can become a $300,000 capital project once code compliance is factored in.
Key liability and operational cost items to track:
- Remediation costs for mold, asbestos, and lead (often $50,000–$500,000+ per incident depending on scope)
- Temporary classroom rental or modular unit costs during remediation
- Legal exposure from parent and staff complaints tied to documented IAQ failures
- Lost state aid from instructional days missed during building closures
- Workers’ compensation claims linked to poor facility conditions
Research shows that better-maintained schools see measurable improvements in student attendance and test scores, with attendance gains of roughly 4–5 students per 1,000 in improved facilities. That attendance recovery translates directly into per-pupil state funding that partially offsets renovation investment.
How capital funding gaps inflate total public-sector costs over time
The national K–12 facilities shortfall of approximately $90 billion is not a single-year problem. It reflects decades of per-student capital and maintenance spending below recommended levels, compounding annually into a backlog that now spans roofing, mechanical systems, electrical infrastructure, and building envelopes across thousands of districts. Nearly half of the nation’s main instructional buildings were built approximately 50 years ago, meaning a large share of the national portfolio is simultaneously approaching or past end-of-life on multiple systems.
When districts delay capital investment, they do not avoid costs — they convert planned capital expenditures into higher-cost emergency spending. EdWeek reporting documents cases where projects ballooned in cost due to material price volatility and forced short-term fixes, outcomes that would have been avoidable with earlier, planned procurement.
| Funding route | Typical timeline | Funding scale | Operating budget impact |
|---|---|---|---|
| General obligation bond | 12–24 months | $10M–$500M+ | Debt service added to annual budget |
| State capital grants | 6–36 months | $500K–$50M | Minimal if grant-funded |
| Capital reserve fund | Ongoing (annual appropriation) | Builds over time | Steady, predictable annual draw |
| Public–private partnership (P3) | 18–48 months | Large-scale projects | Lease or service payments replace capital outlay |
| Federal programs (ESSER, IDEA) | Varies by program cycle | Targeted, often limited | Reduces one-time capital burden |
Practical considerations for district administrators pursuing capital funding:
- Bonds provide the largest single funding event but require voter approval and add long-term debt service.
- State grants are competitive and often require matching funds, but they carry no debt obligation.
- Capital reserve funds are the most financially disciplined approach, building predictable capacity without debt, but require consistent annual appropriations that are politically difficult to protect.
- P3 arrangements shift capital risk to a private partner but require careful contract structuring to avoid long-term cost lock-in.
Actionable steps to reduce cost escalation starting now
Reducing the financial impact of aging infrastructure does not require a full capital program to begin. The most effective approach is a phased, prioritized response that generates measurable savings in the near term while building the evidence base for larger investments.
Immediate actions (0–12 months):
- Complete a systematic facilities condition assessment using a standardized methodology. GAO recommends this as the foundation for any credible deferred maintenance budget, and it produces the asset-condition data needed for board presentations.
- Triage the backlog by risk: separate items that will cascade into secondary damage within 12 months from those that can be safely deferred.
- Implement a preventive maintenance schedule for the highest-cost systems — HVAC, roofing, plumbing — targeting at least 80% preventive completion across those assets.
- Conduct energy tune-ups and controls recommissioning on existing HVAC equipment before the next heating or cooling season.
Medium-term actions (1–3 years):
- Build an asset lifecycle register that tracks installation date, expected service life, and replacement cost for every major system. This is the foundation of campus asset management and the data source for capital planning.
- Implement condition-based monitoring on critical systems using IIoT sensors where budget allows, shifting from time-based to condition-triggered maintenance.
- Align contractor and vendor contracts with planned replacement windows rather than emergency call-out rates.
Long-term actions (3+ years):
- Establish a capital lifecycle replacement plan that schedules system replacements before end-of-life, not after failure.
- Advocate for facilities budgets at 3–7% of total district operating budget, consistent with APPA benchmarks for adequate maintenance funding.
- Secure a stable funding stream — capital reserve, bond cycle, or state grant pipeline — to execute the replacement plan without relying on emergency appropriations.
Pro Tip: A CMMS with preventive scheduling, inventory and parts tracking, and a resource planning dashboard gives facility managers the work order data and KPI reports needed to demonstrate ROI to boards. Shifting from reactive to preventive maintenance, with documented completion rates and cost avoidance figures, is the most credible argument for sustained facilities funding.
Evidence that supports the economic case for maintenance discipline
The financial case for proactive maintenance is well-documented across government audits, industry benchmarks, and academic research. Facility managers who need to persuade a superintendent or CFO have a strong evidence base to draw from.
Key findings from authoritative sources:
- Student outcomes: — Better facility conditions correlate with modest attendance gains per 1,000 students. and measurable test-score improvements, providing a partial financial offset through per-pupil state funding recovery.
Pro Tip: Build a one-page memo for your superintendent using three numbers: today’s deferred maintenance backlog total, the projected cost in five years at the 4x multiplier, and the annual preventive maintenance investment needed to stop the growth. Attach the APPA ROI figure and one sourced case example. That memo is more persuasive than a full facilities report because it speaks in financial terms.
Key Takeaways
Aging school infrastructure increases costs through compounding mechanisms — deferred maintenance, obsolete systems, and chronic underfunding — that grow faster than annual budgets can absorb without deliberate intervention.
| Point | Details |
|---|---|
| Deferred maintenance compounds fast | A $50,000 deferred repair can escalate to $226,000 when secondary damage and emergency rates are included. |
| Preventive maintenance pays measurably | APPA benchmarks show approximately $3.20 in avoided costs for every $1 invested in preventive maintenance. |
| The national shortfall is $90 billion | Per-student capital and maintenance spending runs at roughly half of recommended levels, generating persistent backlog growth. |
| Health and liability costs are non-discretionary | IAQ failures, asbestos, lead, and code deficiencies trigger mandatory remediation and legal exposure that dwarf the original repair cost. |
| Student outcomes improve with facility investment | Attendance gains of roughly 4–5 students per 1,000 and measurable test-score improvements are associated with better-maintained schools. |
The real cost of waiting
The most persistent misconception in school facilities management is that deferring maintenance is a budget decision. It is not. It is a financing decision — one that borrows against future capital at a rate of 4x to 6x, with no formal approval and no repayment schedule. Boards that would never accept a bond at those terms routinely approve deferred maintenance by omission.
What makes this difficult is that the cost of inaction is invisible until it is not. A roof that has been leaking slowly for two years looks like a maintenance problem until the ceiling collapses and the district is looking at mold remediation, temporary classrooms, and a capital project that was never budgeted. The financial pain is real and large; the decision that caused it was made quietly, years earlier, when someone moved the repair to next year’s list.
The practical answer is not to find more money before acting. It is to start with a condition assessment, identify the three to five items most likely to cascade into secondary damage within 12 months, and address those first. That single step converts an abstract backlog into a prioritized, defensible investment plan. It also gives facility managers the documentation they need to present deferred maintenance as what it actually is: a financial liability with a compounding interest rate.
Districts that have made this shift — from reactive to preventive, from anecdotal to data-driven — consistently report fewer emergency events, lower total maintenance costs, and stronger board support for facilities funding. The evidence is there. The tools exist. The question is whether the conversation starts this budget cycle or the next one.
How MPulse Software helps districts reduce facilities cost escalation
Facility managers who have completed a condition assessment and built a prioritized maintenance plan need one more thing: a system that executes the plan consistently and documents the results. That is where a CMMS delivers its clearest return.
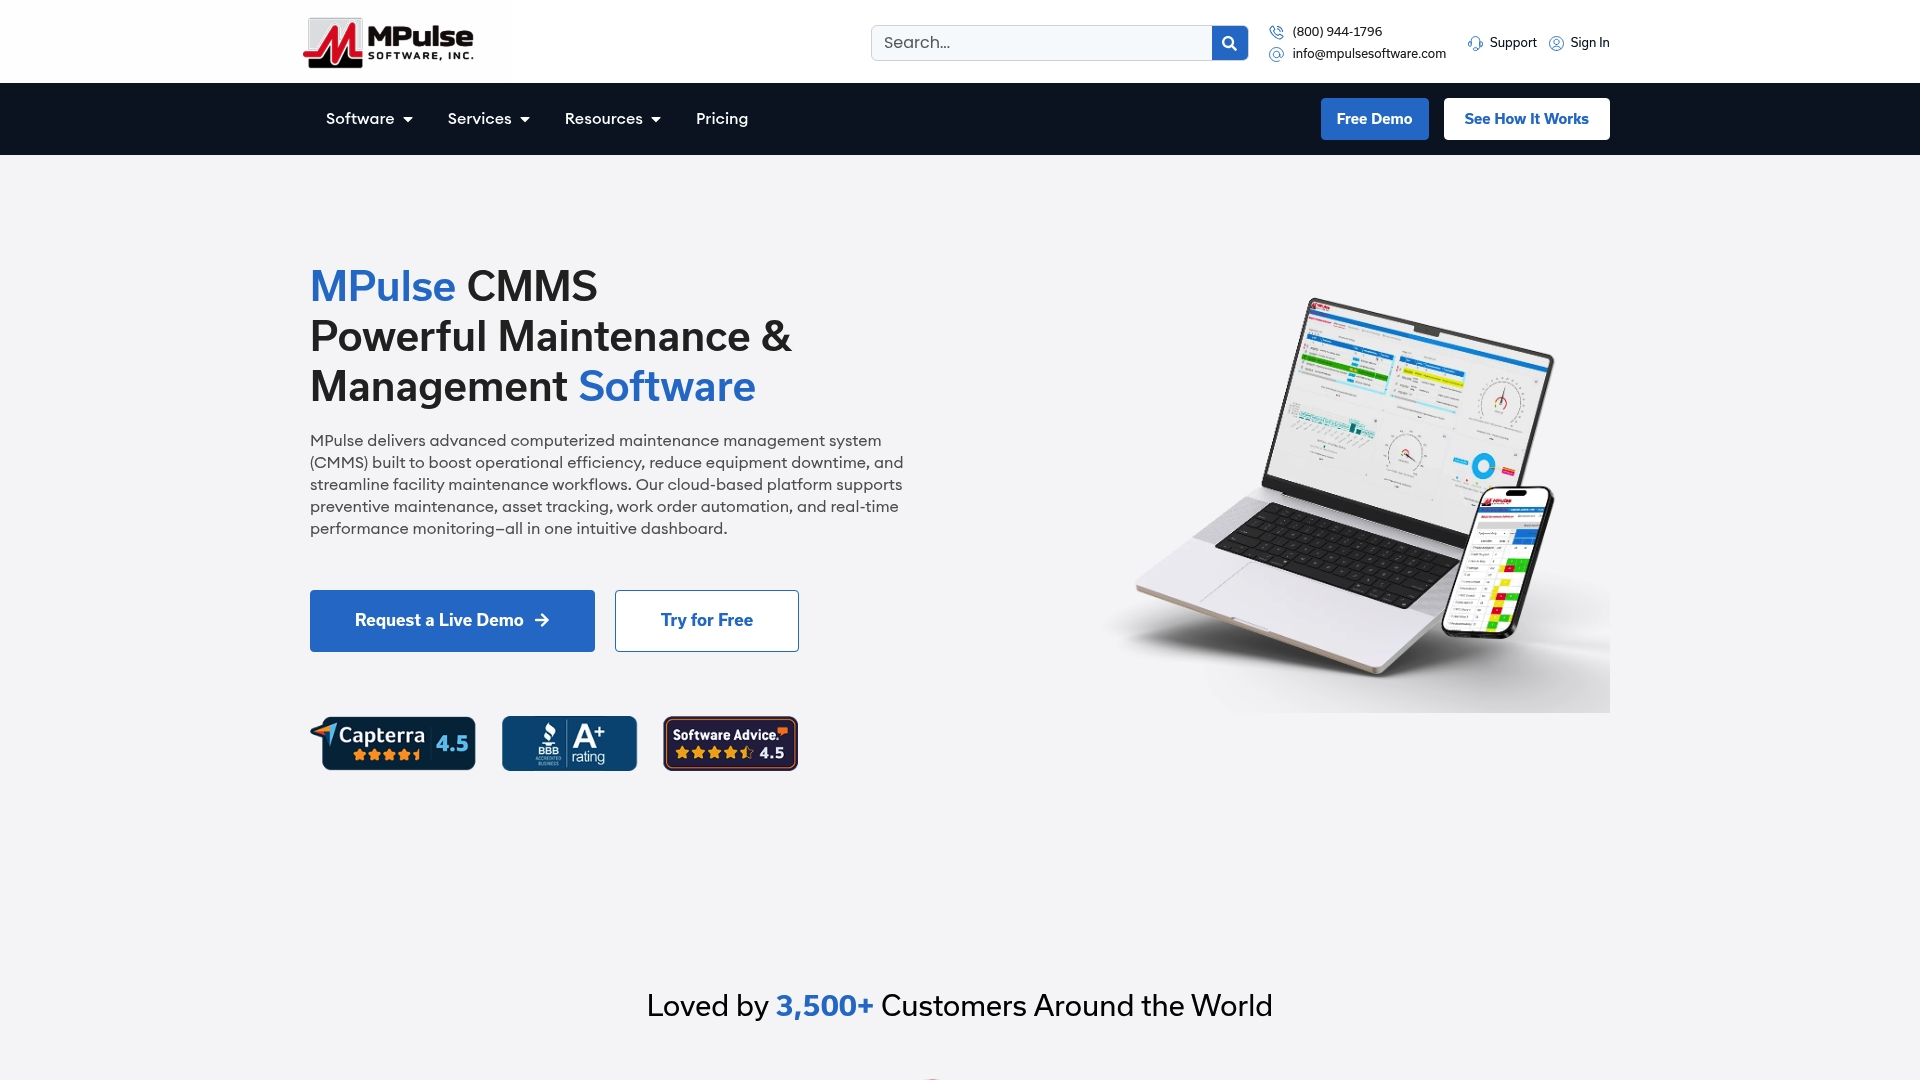
MPulse Software gives school districts the operational infrastructure to shift from reactive to preventive maintenance at scale. Preventive scheduling automates work order generation for HVAC, roofing, plumbing, and electrical systems before failures occur. Asset tracking records installation dates, service histories, and replacement windows so facility teams can plan capital expenditures rather than react to them. The resource planning dashboard produces the KPI reports and cost-avoidance documentation that administrators need for board presentations and grant applications. IIoT integration supports real-time condition monitoring on critical systems, enabling condition-based maintenance that extends asset life without over-servicing.
Over 3,500 customers trust MPulse Software, with documented efficiency improvements of up to 40%. For districts managing aging campuses under tight budgets, that kind of measurable performance is exactly what a board needs to see. Explore MPulse CMMS to see how preventive scheduling and asset tracking can reduce your district’s emergency repair costs and build a credible capital planning record.
Useful sources for building your evidence pack
These reports and articles provide the primary data, case examples, and policy context cited in this article. Each is suitable for inclusion in a board memo, grant application, or capital planning document.
-
K-12 Dive: K–12 facilities need $90B to close maintenance, capital investment shortfall — The most accessible summary of the State of Our Schools report; provides the $90 billion shortfall figure and per-student spending analysis useful for board presentations.
-
GAO-20-494: K-12 Education — School Districts Frequently Identified Multiple Building Systems Needing Updates or Replacement — Federal audit documenting the scope of building system deficiencies across U.S. schools, including HVAC prevalence data and recommendations for condition assessment methodology.
-
Premiere Building: Deferred Maintenance Is Debt — The Reframe That Moves Boards — Practitioner analysis of the 4x–6x deferred maintenance multiplier, the $50,000-to-$226,000 case example, and APPA ROI benchmarks. Directly usable in CFO and board conversations.
-
TASB: 5 Ways Your School Facilities Impact Student Achievement — Summarizes research linking facility condition to attendance and test scores; useful for framing renovation ROI beyond direct cost avoidance.
-
Education Week: School Buildings Are Crumbling — Here’s Why It’s So Hard to Fix Them — Investigative reporting on project cost escalation, material volatility, and the structural barriers districts face in capital planning.
-
EPA: How Does Indoor Air Quality Impact Student Health and Academic Performance — Primary federal source for IAQ-related health and attendance impacts; authoritative for any remediation or ventilation upgrade justification.
-
State of Our Schools 2025 (Montana SFIC summary) — Legislative summary of the national State of Our Schools report, documenting building age data and persistent maintenance gaps across rural, suburban, and urban districts.
The evidence base for school facilities investment is stronger than most boards realize. The challenge is not finding the data — it is presenting it in financial terms that connect deferred maintenance to budget risk rather than to maintenance operations.
FAQ
What is the main reason aging school infrastructure increases costs?
Deferred maintenance compounds through deterioration, secondary damage, and emergency-rate repairs, turning small postponed fixes into large capital events. The 4x–6x cost multiplier means a $50,000 deferred repair can ultimately produce over $226,000 in emergency and remediation costs after failure.
How large is the U.S. K–12 facilities funding shortfall?
The national shortfall approaches $90 billion in combined capital and maintenance needs, with per-student spending running at roughly half of recommended benchmarks according to the State of Our Schools report.
How does preventive maintenance reduce the financial impact of old school buildings?
APPA benchmarks show preventive maintenance avoids approximately $3.20 in future costs for every $1 invested. Shifting to greater than 80% preventive completion typically reduces emergency events by 40–60% within 18 months.
What health and liability costs do aging school facilities generate?
IAQ failures, asbestos, lead, and code deficiencies trigger mandatory remediation, temporary space costs, and legal exposure. Districts also lose state aid tied to instructional days missed during building closures.
How can a CMMS help manage the costs of outdated school facilities?
A CMMS like MPulse Software automates preventive work orders, tracks asset ages and replacement windows, and generates cost-avoidance reports that give administrators the documentation needed to justify facilities investment to boards and grant agencies.