What are the best practices for machine downtime tracking?
Effective machine downtime tracking best practices come down to eight core disciplines that manufacturing teams can implement without waiting for a capital budget cycle:
- Standardize categories into planned and unplanned downtime, with clear sub-reasons aligned to ISO 22400 classifications such as equipment failure, material shortage, process upset, and changeover.
- Limit top-level reason codes to six or fewer. Keeping the list short balances granularity with operator usability and prevents the “unknown fault” default that corrupts data.
- Train operators on why coding matters, not just how to select a code. Operators who understand how their entries drive maintenance decisions enter data far more carefully.
- Use automated data capture with IIoT sensors or PLC monitoring wherever possible. Automated systems catch every state change, including micro-stops operators routinely miss.
- Set a minimum event duration threshold. Five minutes works for manual systems; two minutes suits automated capture. Events below the threshold feed the OEE Performance factor separately.
- Implement real-time alerts for downtime exceeding a set threshold, such as 15 minutes, so maintenance leads can respond before a single-machine stop cascades into a line shutdown.
- Run daily, weekly, and monthly review cycles to convert raw data into prioritized actions rather than historical reports nobody reads.
- Visualize and post downtime results publicly by shift. Visible data creates peer accountability and sustains operator engagement over time.
Table of Contents
- Why accurate downtime tracking is the foundation of manufacturing productivity
- Key metrics every maintenance professional should monitor
- Common challenges that undermine downtime data reliability
- Proven methods for capturing and analyzing downtime data
- Business benefits of getting downtime tracking right
- How to structure reason codes and run continuous improvement cycles
- How downtime tracking integrates with TPM and CMMS strategies
- Real-world results from systematic downtime tracking
- Why employee training determines whether tracking programs succeed
- Analytics and visualization tools that make downtime data useful
- Key Takeaways
- FAQ
Why accurate downtime tracking is the foundation of manufacturing productivity
Machine downtime tracking is the systematic process of recording when a machine stops producing, for how long, and why. That definition is simple. The gap between knowing it and executing it well is where most plants lose ground.
Downtime splits into two distinct types. Planned downtime covers scheduled preventive maintenance, changeovers, cleaning, and inspections. These stops are expected and should be measured against targets. Unplanned downtime covers equipment failures, material shortages, process faults, and external disruptions. The ratio of unplanned to total downtime is one of the clearest indicators of how mature a maintenance program actually is.
Tracking all downtime, including planned changeovers and cleaning, enables targeted reduction efforts and sharper OEE insights. Plants that exclude planned stops from their records miss a substantial portion of non-productive time that is often the most improvable. Accurate tracking underpins every maintenance scheduling decision, from PM interval adjustments to spare parts stocking levels.
Key metrics every maintenance professional should monitor
Raw downtime hours tell you very little on their own. The metrics below convert those hours into decisions.
| Metric | Definition | What it tells you |
|---|---|---|
| Total downtime | Minutes or hours lost per machine, line, or shift | Baseline for all other calculations; segment by planned vs. unplanned |
| OEE Availability | Run time divided by planned production time | Direct measure of how much scheduled capacity is actually used |
| MTBF | Average operating time between unplanned failures | Declining trend signals a degrading asset before the next failure |
| MTTR | Average time to restore a machine after failure | High MTTR often reflects parts availability or technician skill gaps |
| Planned Maintenance % | Proportion of total maintenance that was scheduled | Higher percentage indicates a more proactive, less reactive program |
Availability typically accounts for a large share of total OEE loss across discrete and process manufacturing environments. For a plant running at 70% OEE, improving Availability significantly increases OEE points gained. That makes downtime reduction the highest-leverage target in most facilities.
MTBF deserves particular attention as a trend metric rather than a point-in-time number. A consistent upward trend confirms that maintenance interventions are working. A declining trend is the signal to investigate before the next failure, not after.
Common challenges that undermine downtime data reliability
Poor data quality is the rule, not the exception. Many manually logged records lack a valid root cause, which means every downstream decision, from maintenance scheduling to capital planning, rests on incomplete information.
The most common failure points:
- Forgotten or inaccurate manual entries. Operators fix the machine first and log the stop later, if at all. Short stops are almost never recorded on paper.
- Overly complex reason code lists. When operators face more than 40 codes, they default to “unknown” or pick the closest guess. Operators default to generic codes when the list is too long or unclear.
- Blame culture suppressing accurate reporting. When downtime data is used punitively, operators underreport duration or misclassify events to avoid scrutiny.
- Timestamp inaccuracies. Rounding stop times to the nearest 15 minutes inflates or deflates true downtime by 15%–30%, according to NIST manufacturing data quality guidelines.
- Micro-stops falling below manual thresholds. Micro-stops under 5 minutes are frequently missed and can skew OEE Performance calculations significantly.
- No visible follow-through on reported data. When operators see no improvement action tied to their entries, compliance drops. Factories that visibly connect operator-reported downtime to completed improvement projects maintain much higher data entry compliance than those that collect data without visible follow-through.
A practical audit check: compare recorded downtime against production count shortfalls and maintenance work order records regularly. A variance exceeding a notable margin indicates systemic data quality issues that need correction before the system can drive real improvement.
Proven methods for capturing and analyzing downtime data
Three approaches dominate the field, each with distinct trade-offs.
| Method | Data quality | Cost | Operator effort | Best fit |
|---|---|---|---|---|
| Manual paper or spreadsheet | Low to moderate | Minimal | High | Small shops, low-volume lines |
| CMMS work order tracking | Moderate | Medium | Medium | Maintenance-driven downtime capture |
| Automated IIoT sensor capture | High | Higher upfront | Low | High-volume, continuous production |
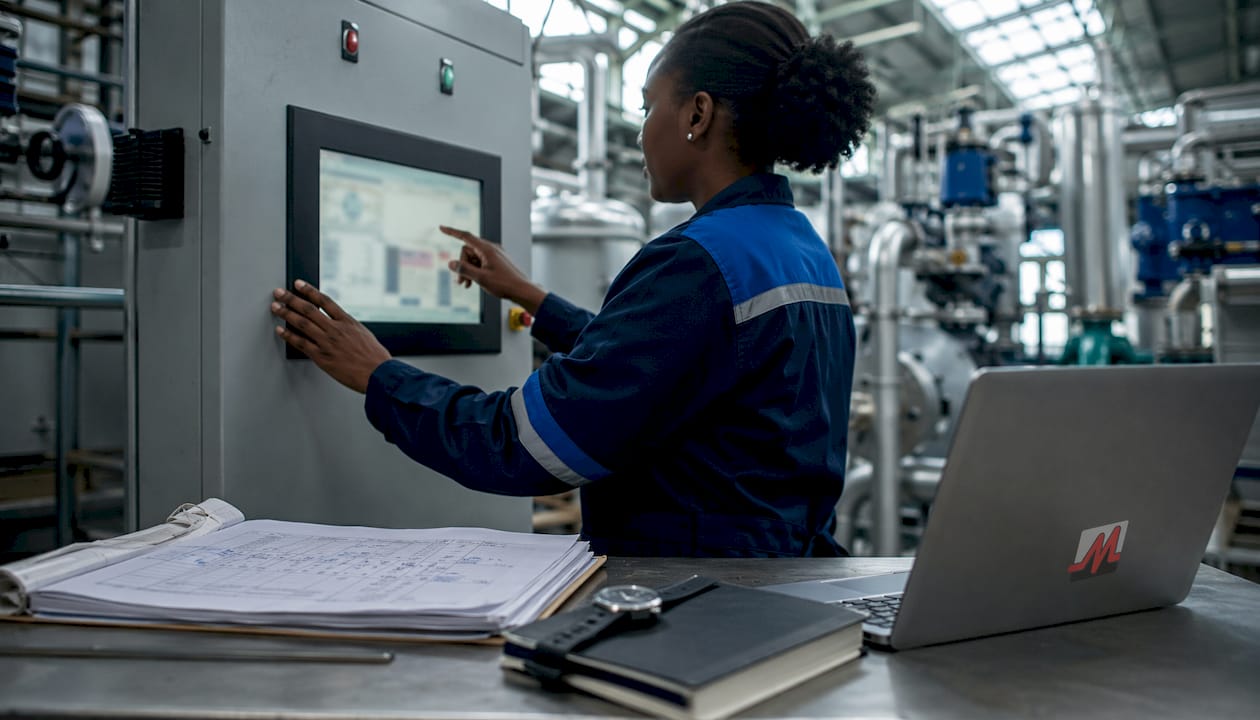
Manual tracking has three structural weaknesses: operators forget to log short stops, durations get rounded, and reason codes lack context. That said, a manual system used consistently can outperform an automated system with data gaps by a factor of three in driving actual downtime reduction. Method selection matters less than execution discipline.
CMMS-based tracking captures maintenance-driven downtime accurately through work order open and close timestamps. The limitation is that only events generating a work order get recorded, so micro-stops and short process faults remain invisible.
Automated capture with IIoT sensors or PLC monitoring records every state change with exact timestamps and no operator burden at the point of capture. Plants transitioning to automated capture often see reported downtime rise initially because they are now counting events that were previously invisible. That initial increase is a sign the system is working, not a sign performance has worsened.
Pro Tip: Set your minimum tracking threshold before going live. Five minutes for manual systems and two minutes for automated capture filters noise without hiding meaningful events. Capture micro-stops separately through the OEE Performance factor rather than mixing them into your downtime Pareto.
Business benefits of getting downtime tracking right
Accurate tracking translates directly into operational and financial gains that compound over time.
- Improved equipment availability through faster identification of repeat failure patterns and targeted PM adjustments.
- More precise maintenance scheduling, shifting resources from reactive firefighting to planned interventions during low-impact windows.
- Reduced unplanned downtime costs. Unplanned downtime costs the average small to mid-size manufacturer $5,600 per hour, yet 62% of these facilities cannot accurately quantify their total downtime or identify their top three root causes.
- Data-backed root cause analysis that focuses engineering effort on the 20% of causes driving 80% of total downtime hours.
- Better OEE scores that reflect real production capacity rather than optimistic assumptions.
- Support for continuous improvement initiatives, giving teams a factual basis for project selection and capital requests.
Manufacturers that implement systematic downtime tracking reduce unplanned stops by 30%–50% within 18 months, not through capital investment, but through the visibility that drives better decisions. Plants deploying real-time tracking frequently see a 15%–25% reduction in unplanned downtime within 6–12 months, driven primarily by faster response times and fewer repeat failures.
How to structure reason codes and run continuous improvement cycles
The data-to-action loop is where most downtime programs stall. Collecting data without acting on it visibly is the single fastest way to destroy operator compliance.
Follow the NIST Continuous Improvement Framework’s three-horizon cycle:
- Daily (15-minute shift huddle): Review previous shift downtime events, update the visual management board, and assign ownership for any open items.
- Weekly (1-hour maintenance review): Generate a Pareto chart by category and by asset, review PM schedule adherence, and assign investigation tasks for the top three contributors.
- Monthly (2-hour operations review): Present OEE, MTBF, MTTR, and PMP trends with month-over-month comparison, review completed improvement projects, and select the next project based on the updated Pareto.
For reason codes, the optimal structure is 5–8 top-level categories with 3–5 subcategories each. A two-level hierarchy, such as Category = Mechanical and Sub-reason = Conveyor belt jam, gives enough granularity for root cause analysis without overwhelming operators. Cross-referencing reported causes with maintenance work orders is the most reliable check against reason-code manipulation.
Stopping blame culture is not a soft management preference. It is a data quality intervention. When operators trust that downtime records are used to improve systems rather than evaluate individuals, they report accurately. Accurate data is what makes every other best practice in this list actually work.
Audit data quality every 90 days during the first year by comparing recorded downtime against production count shortfalls and shift logs. A variance exceeding 15% signals systemic issues that need correction before the program can scale.
How downtime tracking integrates with TPM and CMMS strategies
Downtime tracking does not stand alone. It feeds directly into Total Productive Maintenance (TPM) and CMMS-driven preventive maintenance strategies that keep equipment running reliably.
In a TPM framework, downtime data populates the Autonomous Maintenance and Planned Maintenance pillars. Operators use shift-level downtime records to identify recurring minor issues they can address themselves, while maintenance teams use MTBF and MTTR trends to refine PM intervals and prioritize equipment upgrades. Without accurate downtime data, TPM pillar activities operate on intuition rather than evidence.
A CMMS connects the tracking loop by generating work orders from downtime events, recording technician response times, and closing the feedback loop with parts usage and labor costs. Maintenance scheduling becomes far more precise when PM intervals are calibrated against actual MTBF trends rather than manufacturer defaults. Organizations implementing comprehensive preventive maintenance programs reduce equipment failures by 30%–50% compared to reactive approaches.
Real-world results from systematic downtime tracking
The pattern across facilities that commit to structured tracking is consistent. A plant running at 70% OEE with manual paper logs typically discovers, within the first 30 days of automated capture, that its actual Availability is 8–12 points lower than reported. That gap represents recoverable capacity that requires no new equipment.
One common scenario: a facility identifies “Material Shortage” as its top downtime category after 30 days of clean automated data. The response is not a machine upgrade. It is a revised inventory replenishment process that eliminates the stockouts causing nearly two-hour disruptions per event. The downtime cost calculation that justified the tracking investment pays back within the first quarter.
Facilities that post OEE results by shift and connect reported downtime to completed improvement actions sustain operator engagement far longer than those that collect data quietly. The accountability that comes from visible results is what separates programs that deliver lasting gains from those that fade after the initial rollout.
Why employee training determines whether tracking programs succeed
Technology captures the data. People determine whether it is accurate and whether it drives change. Training that covers only how to select a reason code produces operators who pick the closest option quickly. Training that explains why accurate coding matters produces operators who flag genuinely unknown causes for follow-up rather than guessing.
The most effective training programs cover three areas: the purpose of each reason code category, the consequences of generic or inaccurate coding on maintenance decisions, and the no-blame policy that protects operators who report honestly. Laminated reason-code cards at each workstation reduce the cognitive load of code selection and cut the “unknown fault” default rate noticeably.
Maintenance alerts tied to downtime thresholds give operators immediate confirmation that their entries trigger real responses. That feedback loop, seeing a maintenance lead arrive within minutes of a 15-minute alert, reinforces the value of accurate reporting more effectively than any classroom session.
Analytics and visualization tools that make downtime data useful
Raw downtime data in a spreadsheet answers the question “how much?” Visualization tools answer “where, why, and what next?” The Pareto chart is the workhorse: ranking all downtime events by total hours per category and per asset immediately reveals the 20% of causes driving 80% of total lost time.

Modern CMMS platforms and manufacturing execution systems generate Pareto charts, trend lines, and OEE dashboards automatically from work order and sensor data. For facilities using IIoT sensors, platforms that read machine states via OPC-UA or MQTT deliver sub-second precision and continuous data streams that feed real-time dashboards without manual entry. Tracking downtime events at the shift level and rolling them up to daily and weekly views gives maintenance teams the granularity to spot emerging patterns before they become expensive failures.
Posting shift-level OEE results on a visible board, whether digital or physical, creates the peer accountability that sustains data quality over time. When Shift 1 can see Shift 2’s numbers, healthy comparison replaces indifference.
Key Takeaways
Systematic machine downtime tracking, built on standardized categories, accurate data capture, and structured review cycles, reduces unplanned stops by 30%–50% within 18 months without capital investment.
| Point | Details |
|---|---|
| Standardize reason codes | Limit top-level categories to six or fewer; use a two-level hierarchy for root cause granularity. |
| Automate data capture | IIoT sensors eliminate manual entry gaps and capture micro-stops under 5 minutes automatically. |
| Run three-horizon reviews | Daily huddles, weekly Pareto reviews, and monthly KPI sessions convert data into prioritized actions. |
| Eliminate blame culture | No-blame policies drive accurate reporting and sustain high data entry compliance that visible follow-through produces. |
| Integrate with CMMS and TPM | Downtime data calibrates PM intervals, feeds work order generation, and supports continuous improvement project selection. |
FAQ
What is machine downtime tracking?
Machine downtime tracking is the systematic process of recording when a machine stops producing, for how long, and why, covering both planned stops like scheduled maintenance and unplanned stops like equipment failures. Accurate tracking feeds OEE, MTBF, and MTTR calculations that drive maintenance decisions.
How many reason codes should a downtime tracking system use?
Limit top-level reason codes to six or fewer categories, with 3–5 subcategories each. More than 40 codes causes operator confusion and degrades data quality.
How much can systematic downtime tracking reduce unplanned stops?
Manufacturers implementing systematic downtime tracking reduce unplanned stops by 30%–50% within 18 months, according to McKinsey operational excellence research, without capital investment.
What is the difference between MTBF and MTTR?
MTBF measures average operating time between unplanned failures and indicates asset reliability trends. MTTR measures how long it takes to restore a machine after failure and often reflects spare parts availability or technician skill gaps rather than failure severity alone.
How often should downtime tracking data be audited?
Audit downtime data every 90 days during the first year by comparing recorded downtime against production count shortfalls and shift logs. A variance exceeding 15% signals systemic issues that need correction before the program can scale.
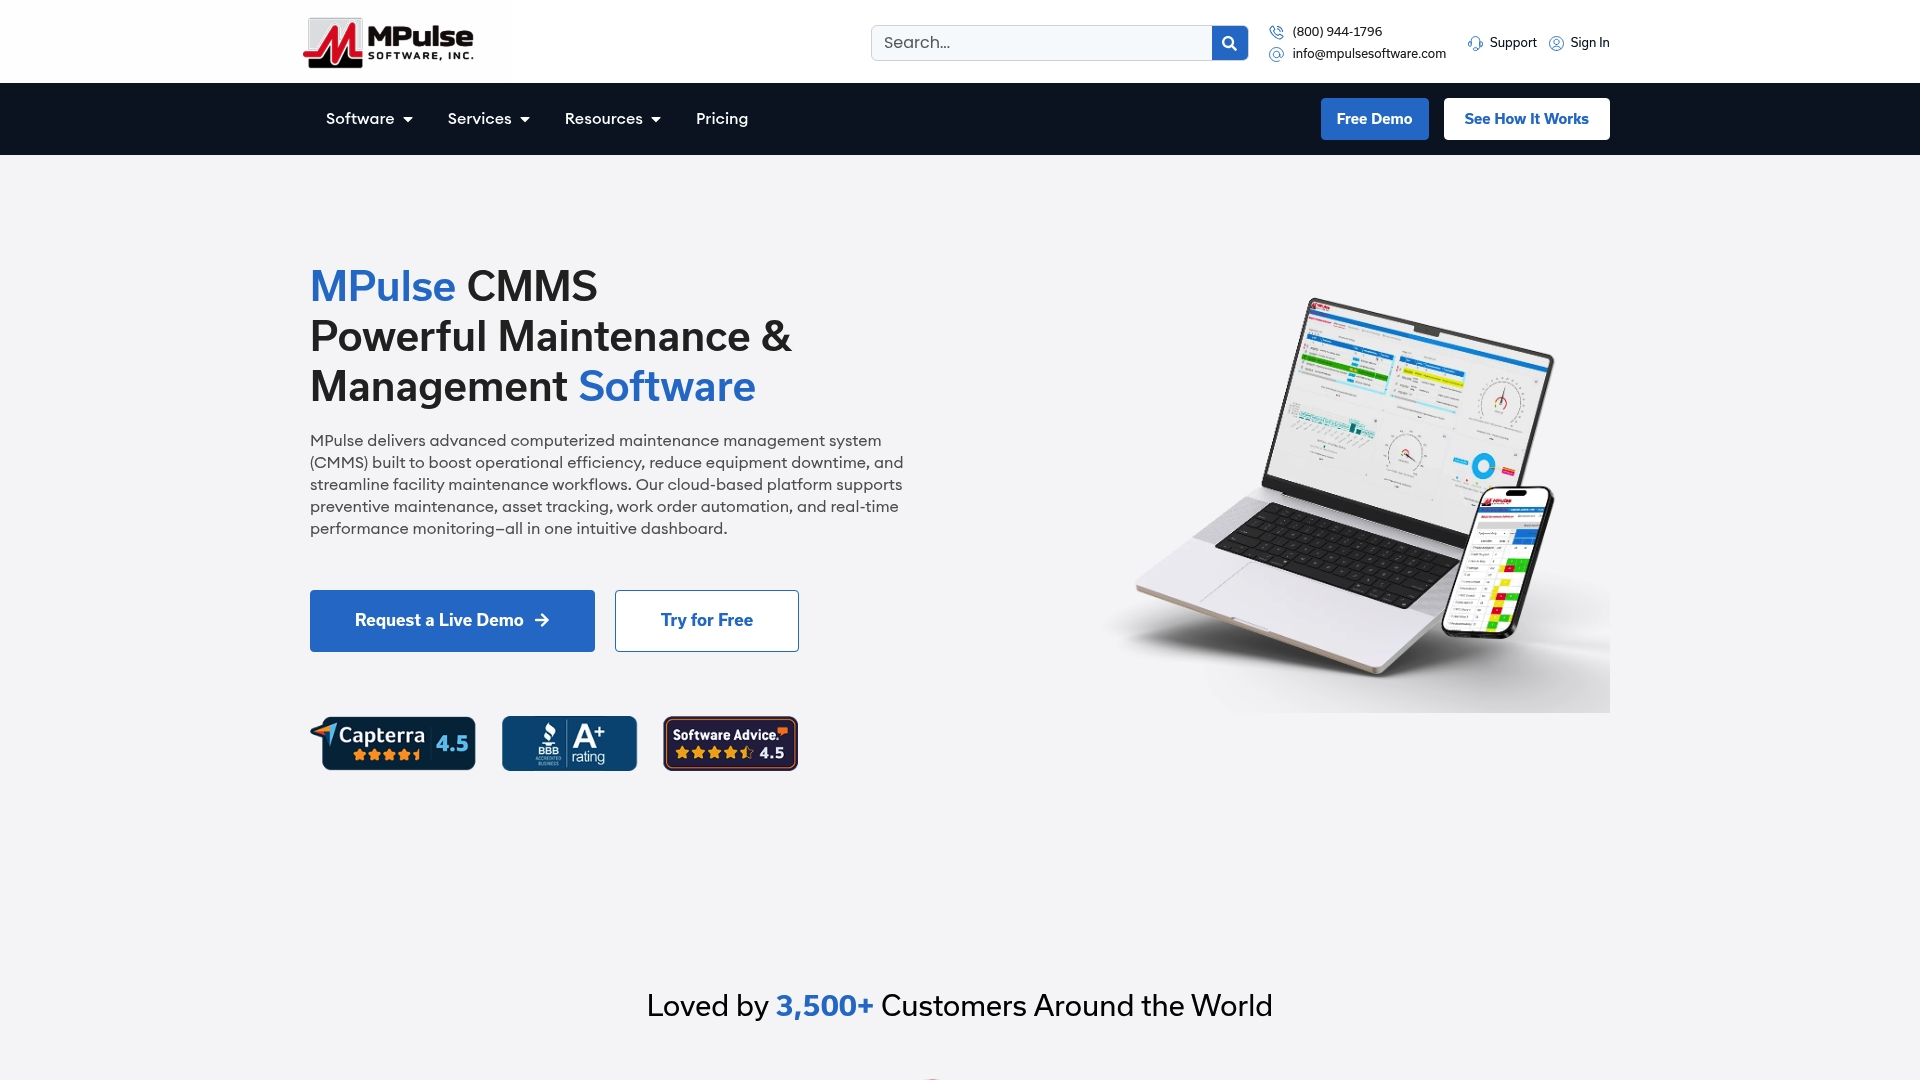
MPulse Software gives maintenance teams the tools to put these practices into production. With automated work order generation, real-time alert configuration, and built-in OEE and MTBF reporting, MPulse closes the gap between data collection and visible action. Many customers trust MPulse to reduce unplanned downtime and build the maintenance program maturity that keeps equipment running. Explore MPulse CMMS and see how structured downtime tracking translates into measurable efficiency gains for your facility.