
CMMS Dashboards That Show Every User What Needs Attention
Open MPACT and see your operation: live KPIs, open work, overdue PMs, and today’s schedule, arranged the way you work. Every login gets its own dashboard in MPACT CMMS by MPulse Software.
What Is a CMMS Dashboard?
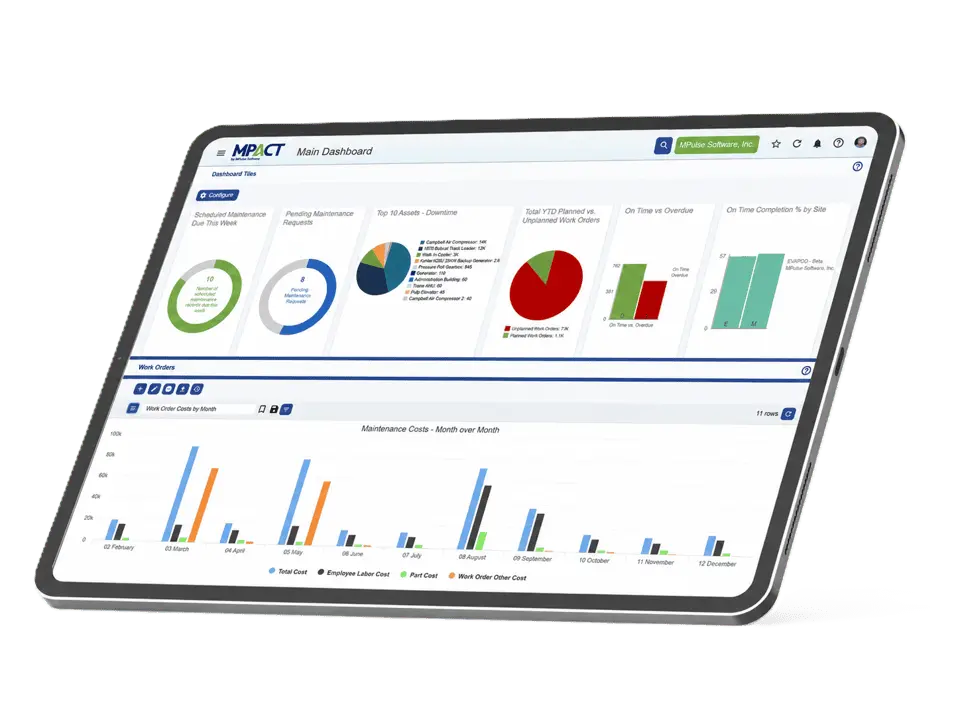
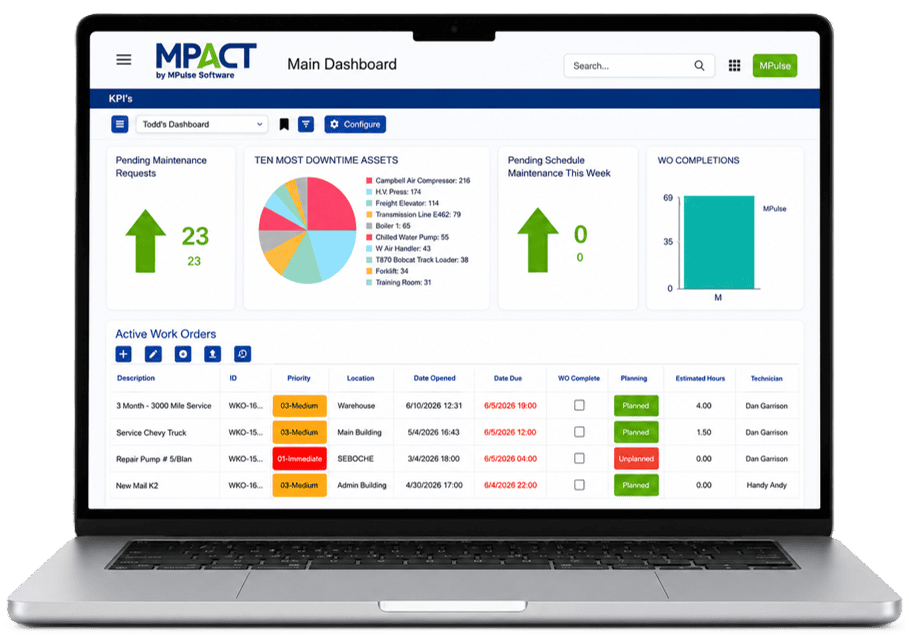
A CMMS dashboard is the configurable home screen of your maintenance system. It displays key performance indicators, work order status, schedules, and asset data as tiles, tables, calendars, and charts, so users see the current state of maintenance the moment they sign in. In MPACT, dashboards are configured per login, so a manager, a technician, and an executive each see the view that fits their job.
The 7 a.m. Question
Every maintenance day starts the same way: what needs attention right now? When the answer lives in a dozen screens, a whiteboard, and someone’s memory, the first hour goes to finding out instead of acting.
An MPACT dashboard answers it at a glance. Overdue work, today’s PMs, open requests, and the KPIs you have chosen sit on one screen, current the moment you open it.
Dashboards Built Around Each User
A dashboard for every login
Pre-built KPI stat tiles
Tables, calendars, and charts on one screen
From tile to record in one click
What Different Roles Put on Their Dashboards
Maintenance Managers
Open work by priority and age, overdue PMs, technician workload, downtime this week
Technicians
My assigned work orders, today’s schedule, parts availability for upcoming jobs
Executives and Finance
Maintenance cost trends, PM compliance, asset availability across locations
Dashboards or Reports?You Use Both.
Dashboards answer what needs attention right now. Reports answer what happened and what it cost, with unlimited custom builds and PDF, XLS, and CSV export. Both pull from the same MPACT records. See maintenance reporting.
Frequently Asked Questions About CMMS Dashboards
Can each user have their own dashboard?
Yes. MPACT dashboards are configured per login. Each user chooses the KPI tiles, tables, calendars, and charts that match their role, and permissions control what data each dashboard can show.
What KPIs can I put on a maintenance dashboard?
Pre-built stat tiles cover common maintenance measures, and dashboards can also display work order grids, PM calendars, and charts. Typical choices include open work orders by priority, overdue preventive maintenance, downtime, and maintenance cost trends.
Do MPACT dashboards update in real time?
Dashboards reflect the current records in MPACT, so the numbers you see match the state of work orders, schedules, and assets when you load the view.
Can I restrict what different users see on dashboards?
Yes. Custom user permissions and location-based permissions control access, so each dashboard only surfaces the sites, records, and data its owner is allowed to see.
See Your Operation on One Screen
Tell us the three numbers you check every morning, and we will show you the dashboard that has them waiting. Demos can be built around your own data.