A school maintenance budget breaks into four working parts: operations and preventive maintenance (M&O), capital renewal for major replacements, a deferred-maintenance reserve, and a contingency line for unplanned items. Utilities and staffing costs typically sit inside M&O as their own tracked categories. The most defensible budgets treat capital as separate money from operating funds, hold a deferred-maintenance reserve at roughly 2% of the annual operating budget, and size the whole facilities program against current replacement value (CRV) rather than guessing at last year’s number plus inflation.
Three numbers matter more than the rest:
- 2% of operating budget set aside annually as a deferred-maintenance reserve, per SAIS guidance.
- 5–7% of CRV as the combined benchmark for M&O plus capital spending, using the SKPI method from the National Center on School Infrastructure.
- Six data points boards expect at every budget presentation, covered in detail further down.
The sections below walk through the allocation framework, the math behind the benchmarks, and exactly what to bring to a board meeting.
Key Takeaways
A defensible school maintenance budget separates M&O from capital, benchmarks spending against CRV using the SKPI method, and holds a liquid deferred-maintenance reserve near 2% of operating budget.
| Point | Details |
|---|---|
| Separate M&O and capital | Keep routine operations funded from the operating budget and major replacements funded from a distinct capital source. |
| Benchmark against CRV | Target 5–7% of current replacement value combined for M&O and capital spending. |
| Fund the reserve annually | Set aside about 2% of the operating budget each year specifically for deferred maintenance. |
| Bring six numbers to the board | GSF, CRV per GSF, backlog dollars, current outlays, SKPI comparison, and reserve balance win approvals. |
| Automate the data collection | MPulse CMMS turns asset and work-order history into board-ready backlog and PM reports without manual rebuilding. |
This article is general information, not a substitute for advice from a qualified financial advisor. Consult a qualified financial professional about your own circumstances before acting on anything here.
Table of Contents
- How to Assess Your School’s Maintenance Needs
- Building the Core Allocation Model
- Benchmarks and a Worked Budget Example
- Prioritizing Repairs Without Falling Into the Deferred-Maintenance Trap
- Preventive Maintenance and the Five-Year Capital Schedule
- What Boards Actually Want to See
- How a CMMS Turns Maintenance Data Into a Budget Case
- Legal and Regulatory Requirements That Shape the Budget
- What Twenty Years of Budget Cycles Teach You About Timing
- Where MPulse CMMS Fits Into This Process
- Sources
- FAQ
How to Assess Your School’s Maintenance Needs
You cannot allocate money correctly until you know what you are maintaining. Start with an asset inventory: gross square footage (GSF), current replacement value (CRV) per GSF, and a system-by-system register covering roof, HVAC, electrical, plumbing, and interior finishes. Each entry needs an age, a useful-life estimate, and the date of the last major service.
From there, run a condition assessment. You do not need an engineering firm for this at the outset. A simple Good, Fair, or Poor rating on each major system, cross-checked against age and expected remaining life, gives you a workable baseline. The NCES facilities guidance treats GSF, CRV, and life-cycle assumptions as the three essential inputs for any credible budget.
Once you have condition data, size your deferred-maintenance backlog:
- Pull two to three years of work-order history to find repeat failures and postponed repairs.
- Convert each Poor-rated system into an estimated replacement cost using CRV per GSF.
- Sum those figures into a single backlog dollar amount. That number becomes your starting argument for reserve funding and capital priority.
Building the Core Allocation Model
Every category in a maintenance budget serves a different purpose, and mixing them is how districts end up quietly underfunding capital renewal for years. Operating maintenance (M&O) covers routine inspection, cleaning, minor repairs, and preventive maintenance contracts. It draws from the general operating fund. Capital renewal covers roof replacements, HVAC overhauls, and structural work, and it typically draws from bonds, state grants, or a dedicated capital fund. Treating these as one pool, according to research from UC Berkeley’s Cities and Schools program, is a common and costly mistake. When capital needs get paid out of an already-strained operating fund, routine maintenance is what gets cut first.
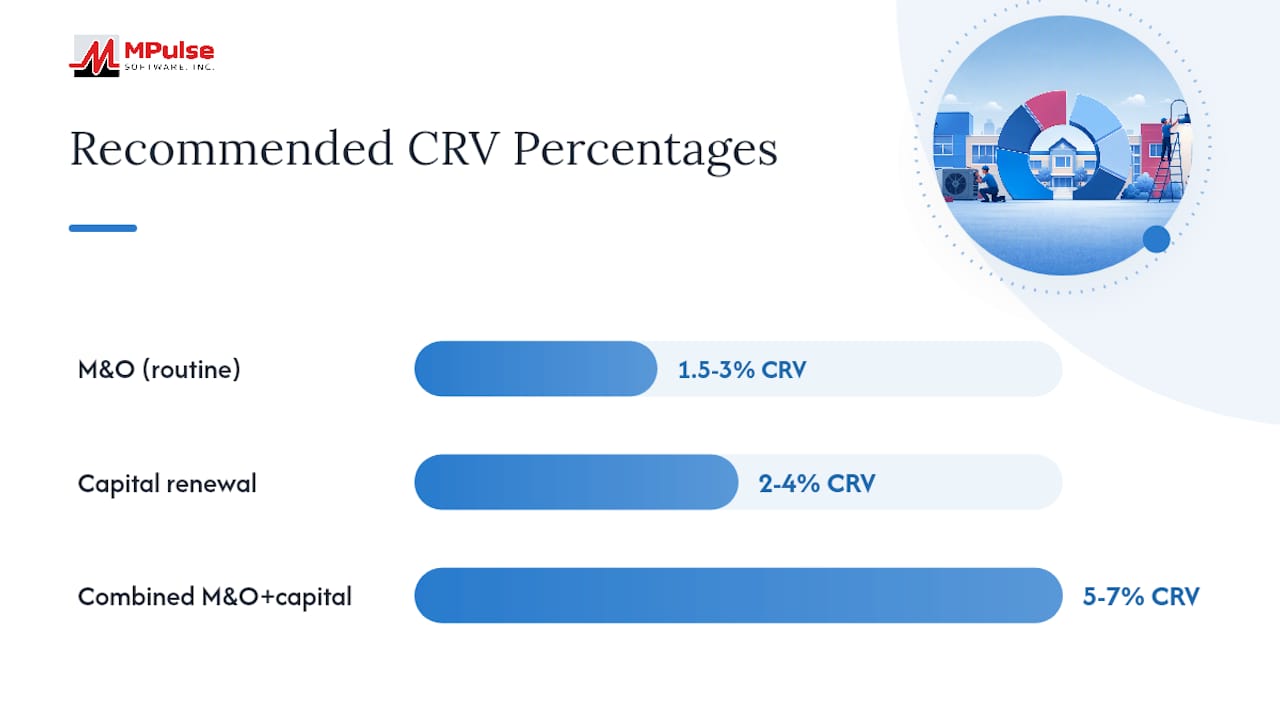
Here is how the categories typically break down against CRV or operating budget, depending on which base makes sense for your reporting:
| Category | Recommended Range | Basis |
|---|---|---|
| M&O / routine preventive maintenance | 1.5–3% of CRV | Cities & Schools research |
| Capital renewal | 2–4% of CRV | Scales up with backlog size |
| Deferred-maintenance reserve | ~2% of operating budget | SAIS guidance |
| Combined M&O + capital | 5–7% of CRV | National Center on School Infrastructure |
Utilities and facilities staffing usually live inside the M&O line as their own sub-accounts rather than as separate top-level categories, since they scale with the same square footage and operating calendar.
To turn those percentages into actual line items:
- Staffing and contracted labor come first, since preventive work depends on having people to do it.
- Supplies, parts inventory, and PM service contracts follow, sized against your asset register.
- Major systems replacement gets its own capital line, prioritized by the condition assessment.
- The deferred-maintenance reserve is a cash account, not a bookkeeping entry, held separate from depreciation.
Benchmarks and a Worked Budget Example
The SKPI (Stewardship Key Performance Indicator) formula gives you a defensible number instead of an educated guess: GSF × CRV per GSF × depreciation rate. The depreciation rate acts as a stand in for the percentage of a building’s value that wears out each year and needs reinvestment, and the National Center on School Infrastructure frames combined M&O and capital spending in the 5–7% of CRV range as the target this formula should land near.
A rough percent-of-operating-budget check works alongside SKPI.
Here is a simplified worked example for a single campus:
| Input | Value |
|---|---|
| Gross square footage (GSF) | 150,000 sq ft |
| CRV per GSF | $250 |
| Total CRV | $37,500,000 |
| Depreciation rate assumed | 2% |
| Annual SKPI target (M&O + capital) | $750,000 |
| Deferred-maintenance reserve (2% of $8M operating budget) | $160,000 |
Assumptions: CRV per GSF reflects current regional construction costs, and the depreciation rate is a planning estimate, not an accounting figure. Run this calculation separately for each campus if your district has buildings of very different ages, since a 1960s elementary school and a 2015 addition depreciate at different real rates even if the formula treats them the same.
Prioritizing Repairs Without Falling Into the Deferred-Maintenance Trap
When the ask exceeds the budget, and it usually does, you need a scoring method that survives scrutiny. Rate every open item on consequence of failure: safety risk, likelihood of service interruption, regulatory exposure, instructional disruption, and cost inflation if delayed another year.
A simple triage order works in practice:
- Life-safety and code violations move first, without exception.
- High-consequence systems that would shut down a building or program come next (failed boilers, compromised roofs, electrical faults).
- Lifecycle-driven replacements follow, scheduled against remaining useful life rather than crisis timing.
The deferred-maintenance reserve should feed directly into this triage, not sit untouched as a rainy-day fund. If a Poor-rated HVAC system scores high on consequence of failure, that reserve is the funding source, and drawing it down is the plan working as intended, not a failure of planning.
Preventive Maintenance and the Five-Year Capital Schedule
Preventive maintenance frequencies should follow manufacturer guidance and asset condition, not a generic calendar. Rooftop units, boilers, and electrical switchgear each have different service intervals, and your CMMS asset register should carry those specifics per unit.
- Build PM schedules directly from manufacturer life-cycle data, not from last year’s calendar.
- Lay out a rolling five-year capital schedule that sequences planned replacements against your condition assessment, leaving room for unplanned work.
- Use reserve funds and capital timing to smooth spending. Spreading two major roof replacements across three years instead of one avoids the budget spike that makes boards nervous.
This kind of funding smoothing is what separates districts that get capital requests approved from those that get told to wait another year.
What Boards Actually Want to See
Board members and finance committees respond to specific numbers, not descriptions of need. The Incident IQ guidance for facility managers recommends building requests directly from forecasting, condition inventories, and work-order history rather than narrative alone.
Six key data points are important for a budget presentation:
- Gross square footage (GSF) across the portfolio
- CRV per GSF, updated annually for construction cost inflation
- Measured deferred-maintenance backlog in dollars
- Current annual M&O and capital outlays
- SKPI benchmark comparison against the 5–7% of CRV target
- Deferred-maintenance reserve balance and its trend over time
A benchmark comparison bar chart, a backlog trend line, and a prioritized project list with consequence scores and costs attached turn those six numbers into something a board can act on in one meeting. Report operational metrics quarterly and give a full capital update annually, timed to the budget cycle.
Board checklist: a one-page budget summary, the benchmark comparison, your top five capital priorities, a funding plan showing sources, and a specific ask with an amount and timeline.
How a CMMS Turns Maintenance Data Into a Budget Case
A computerized maintenance management system does the heavy lifting behind every number above: it holds the asset register with age and life-cycle data, rolls up work-order costs by system and building, tracks PM completion rates, and values the deferred-maintenance backlog automatically as condition data changes. Districts that convert years of scattered work-order history into a single prioritized capital list, instead of rebuilding that analysis from spreadsheets each budget cycle, tend to get faster approvals and can show ROI within one to three budget cycles.
Pro Tip: Set your CMMS reporting cadence to match your board’s meeting schedule, not the other way around. If the board meets quarterly, generate the backlog and PM completion reports the week before, every time, so the numbers become a routine expectation rather than a special request.
Legal and Regulatory Requirements That Shape the Budget
Facility budgets do not exist in a vacuum, and some funding rules are not optional. California’s Routine Restricted Maintenance Account (RRMA) requirement is a clear example: districts that accept State Facility Program funding must deposit at least 3% of general fund expenditures annually into a restricted maintenance account, according to the state’s facility infrastructure profile. Other states attach similar strings to bond proceeds or state matching grants, so check your own state’s education finance rules before assuming your reserve structure is purely discretionary.
Health and safety codes add another layer. Fire code inspections, boiler certifications, asbestos and lead management plans, and ADA accessibility requirements often carry mandatory remediation timelines that override your internal prioritization scheme. The CDC’s Whole School, Whole Community, Whole Child framework ties facility condition directly to student health outcomes, which is worth citing when a safety-related repair needs to jump the queue ahead of a lower-risk capital item.
Bond covenants and grant terms can also restrict how capital funds get spent, sometimes down to the specific system or building named in the ballot measure. Read the fine print before assuming capital dollars are fungible across your portfolio, and loop in your business office early when a repair might touch a restricted funding source.
What Twenty Years of Budget Cycles Teach You About Timing
Condition assessments and SKPI calculations take real time. For a single campus, expect a few weeks. For a district with a dozen buildings of mixed vintage, plan on two to three months to do it properly, especially the first time.
The bigger lesson is political, not technical. Get finance, school leadership, and operations staff involved before the numbers are final, not after. A superintendent who sees the backlog data in March has time to build support before the May budget vote; one who sees it in April is stuck reacting.
Competing priorities never go away. The practical fix is keeping a live, one-page facilities dashboard in front of leadership year-round, not just at budget season.
Where MPulse CMMS Fits Into This Process
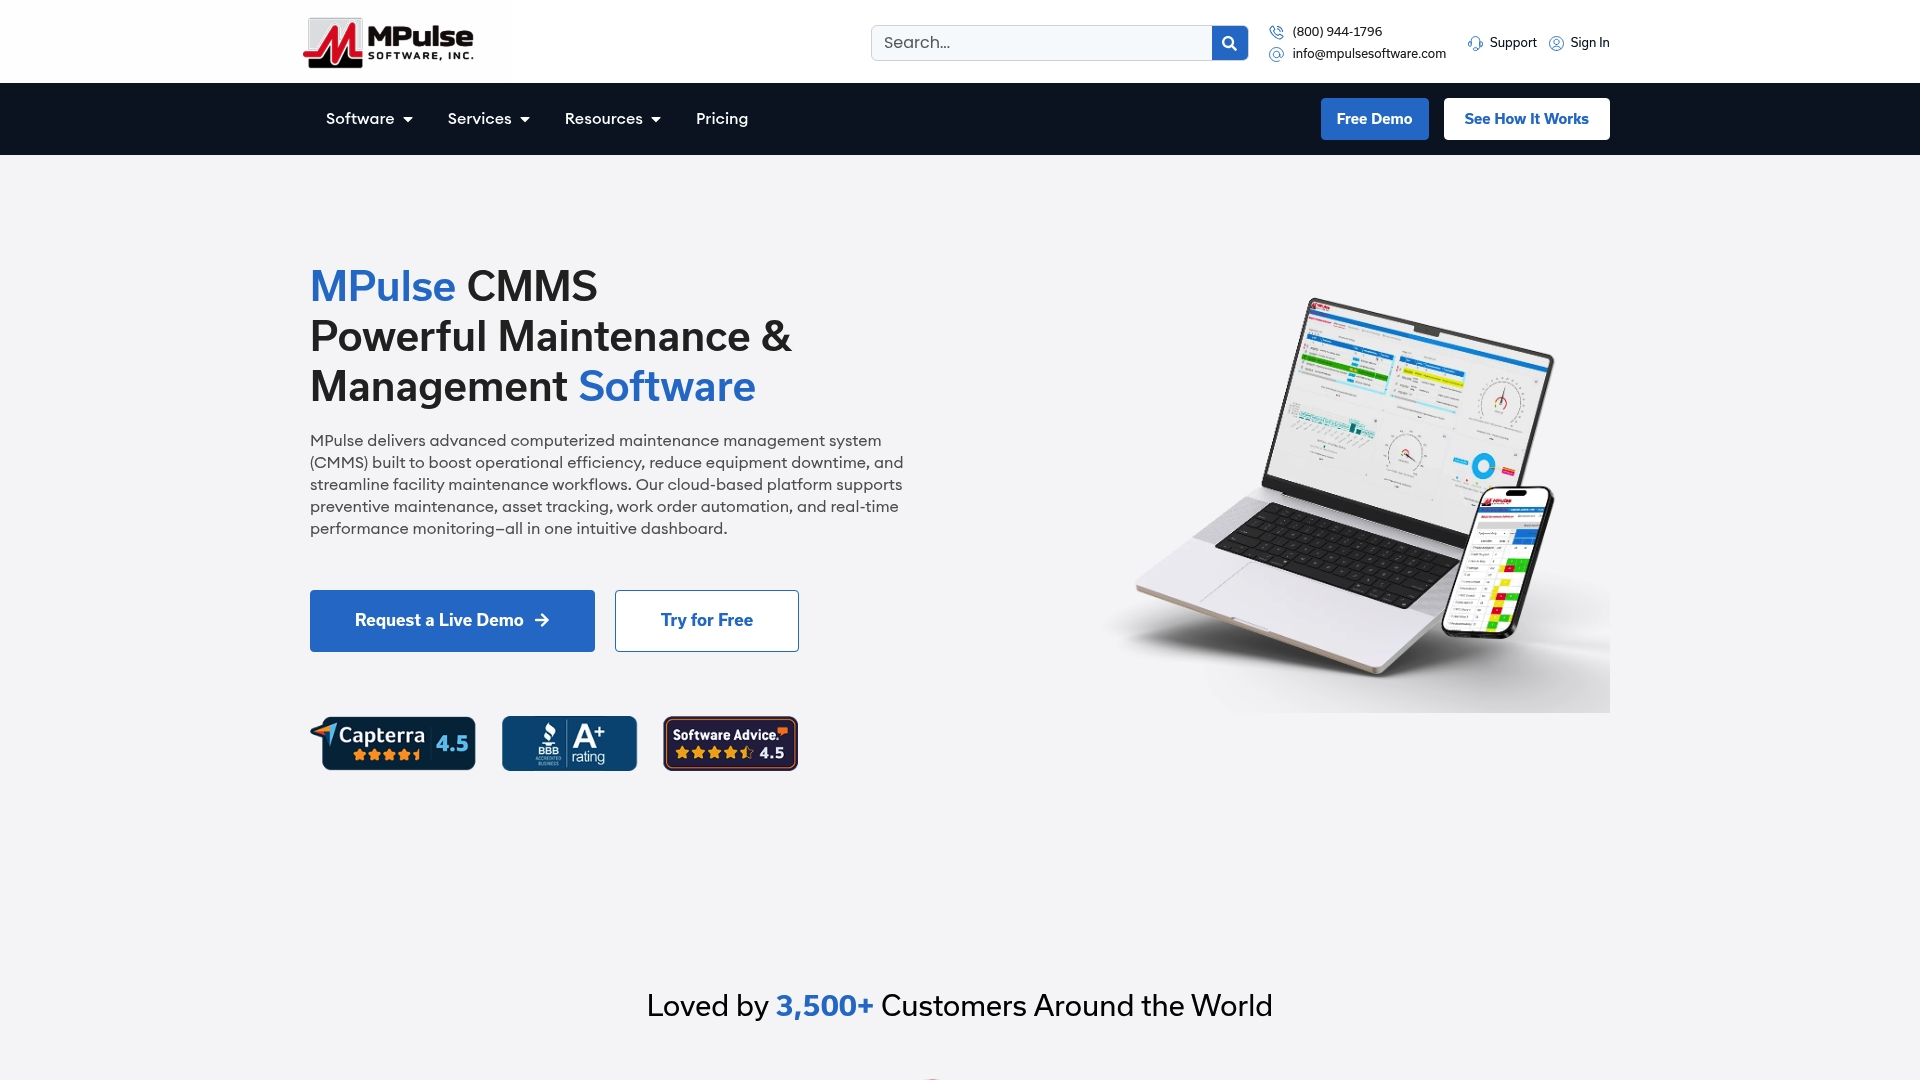
Every framework in this guide, from asset registers to SKPI benchmarking to board-ready backlog reports, depends on clean, current data. MPulse CMMS captures asset and work-order history as it happens, builds backlog valuations automatically from condition entries, and exports the exact metrics finance committees ask for without a manual spreadsheet rebuild each cycle.
Facility teams using a structured CMMS approach typically see three concrete shifts:
- Faster budgeting cycles, since backlog and PM data are already organized when the request is due.
- Repeatable reports that hold up to scrutiny year after year, not one-off spreadsheets built under deadline.
- Fewer unplanned outages, because preventive maintenance schedules run on asset life-cycle data instead of guesswork.
MPulse Software has supported over 3,500 organizations with these kinds of measurable efficiency gains. If your next board presentation needs the six data points covered above pulled together without a manual scramble, see how MPulse CMMS handles school facility budgeting and request a demo to walk through your own campus numbers.
Sources
- Chapter 1 Introduction to School Facilities Maintenance – NCES
- School Budget Planning Tips for Facility Managers – Incident IQ blog
FAQ
What Percentage of a School Budget Should Go to Maintenance?
Combined M&O and capital spending typically falls between 5% and 7% of current replacement value (CRV), with routine M&O alone often running 1.5–3% of CRV depending on building age and condition.
What Is the Formula for Calculating Maintenance Cost?
The SKPI method multiplies gross square footage by CRV per square foot by an annual depreciation rate to produce a defensible annual funding target for combined M&O and capital needs.
What Are the Main Components of a School Maintenance Budget?
The core components are operating maintenance (M&O), capital renewal, a deferred-maintenance reserve, utilities and staffing (usually nested inside M&O), and a contingency line for unplanned repairs.
Does the 50/30/20 Budget Rule Apply to School Maintenance?
Maintenance budgets rely on CRV-based benchmarks and the roughly 2% deferred-maintenance reserve standard.
How Can a CMMS Help Structure a Maintenance Budget?
A CMMS like MPulse tracks asset age, work-order costs, and PM completion automatically, which turns raw maintenance history into the backlog valuations and benchmark comparisons boards expect to see at budget time.