
Min and max levels define the two numbers that keep an MRO storeroom running: Min is your reorder point, the moment average demand during lead time plus a safety stock buffer says “order now.” Max is Min plus your order quantity, the ceiling you order up to. Set Min from usage and lead-time data, set Max from Min plus a sensible order size, and triage critical spares first, before rolling the method across the rest of the catalog. For the MRO fundamentals, see maintenance, repair, and operations (MRO) basics.
TL;DR:
- Min levels should be set based on usage and lead time data, not on historical averages, to prevent stockouts during demand spikes or delays.
- Max levels should be calculated as Min plus an appropriate reorder quantity or EOQ, factoring in supplier packaging and ordering costs for efficiency.
- Safety stock can be determined using simple formulas for steady demand or statistical methods for critical items, emphasizing demand variability and service level targets.
- Implementing min/max policies for non-critical or low-value items may be unnecessary, as two-bin systems or Kanban can manage those inventory needs more simply.
- Automated systems like MPulse CMMS improve accuracy, trigger reorder points automatically, and support regular review, reducing manual errors and ensuring inventory control.
Table of Contents
- What Min and Max Levels Actually Mean for MRO Parts
- Formulas and Calculations for MRO Reorder Points
- How to Set and Pilot Min/Max Levels Step by Step
- When Min/Max Isn’t Enough
- Common Min/Max Mistakes That Cause Stockouts or Excess
- How MPulse CMMS Puts Min/Max Into Practice
- Considerations for Seasonal Fluctuations in MRO Inventory
- An Editorial Take on Getting Min/Max Right
- Automating Min/Max Governance With MPulse CMMS
- Sources
- FAQ
What Min and Max Levels Actually Mean for MRO Parts
The terminology trips up more managers than the math does. Min is not “how much we usually keep on hand.” It is the reorder point, or ROP, the quantity remaining at the exact moment you need to place a new order so stock doesn’t run out before the replenishment arrives.
Max, meanwhile, is the order-up-to level. It tells your system or your storeroom clerk how high to fill the bin once a reorder fires. The gap between the two is your reorder quantity, and that gap should reflect real ordering economics, not a round number someone picked five years ago.
A few terms worth locking down before you start calculating:
- Reorder point (Min): the trigger quantity that starts a new purchase order or work order for parts.
- Safety stock: the buffer inside Min that absorbs demand spikes or late deliveries.
- Order-up-to level (Max): the target quantity after replenishment, equal to Min plus order quantity.
- Reorder quantity: the fixed amount ordered each time, often based on supplier packaging, minimum order quantities, or an economic order quantity (EOQ) calculation.
Min/max fits fast-moving, steady-consumption items well: filters, bearings, gaskets, lubricants. It fits poorly for one-off capital spares or single points of failure, where a criticality-based or RAM-based approach does a better job of matching stock to actual failure risk.
Formulas and Calculations for MRO Reorder Points
Here’s the core formula you can paste into a spreadsheet right now:
- Reorder Point (Min) = (Average Daily Usage × Lead Time in Days) + Safety Stock
- Safety Stock (simple method) = (Maximum Daily Usage − Average Daily Usage) × Maximum Lead Time
- Safety Stock (statistical method) = Z-score × Standard Deviation of Demand × √Lead Time
- Max = Min + Reorder Quantity (or Min + EOQ, where EOQ balances ordering cost against holding cost)
The simple max-min method works fine for most consumables. Save the statistical method, which uses a service-level Z-score, for parts where a stockout stops production, since it lets you size the buffer around actual demand variability rather than a worst-case guess.
Worked example, slow-moving critical spare: A bearing averages 0.5 units used per day, with a 30-day lead time and a maximum observed usage of 1.2 units per day during a bad month. Safety stock = (1.2 − 0.5) × 30 = 21 units. ROP = (0.5 × 30) + 21 = 36 units. If the reorder quantity is 10, Max = 46.
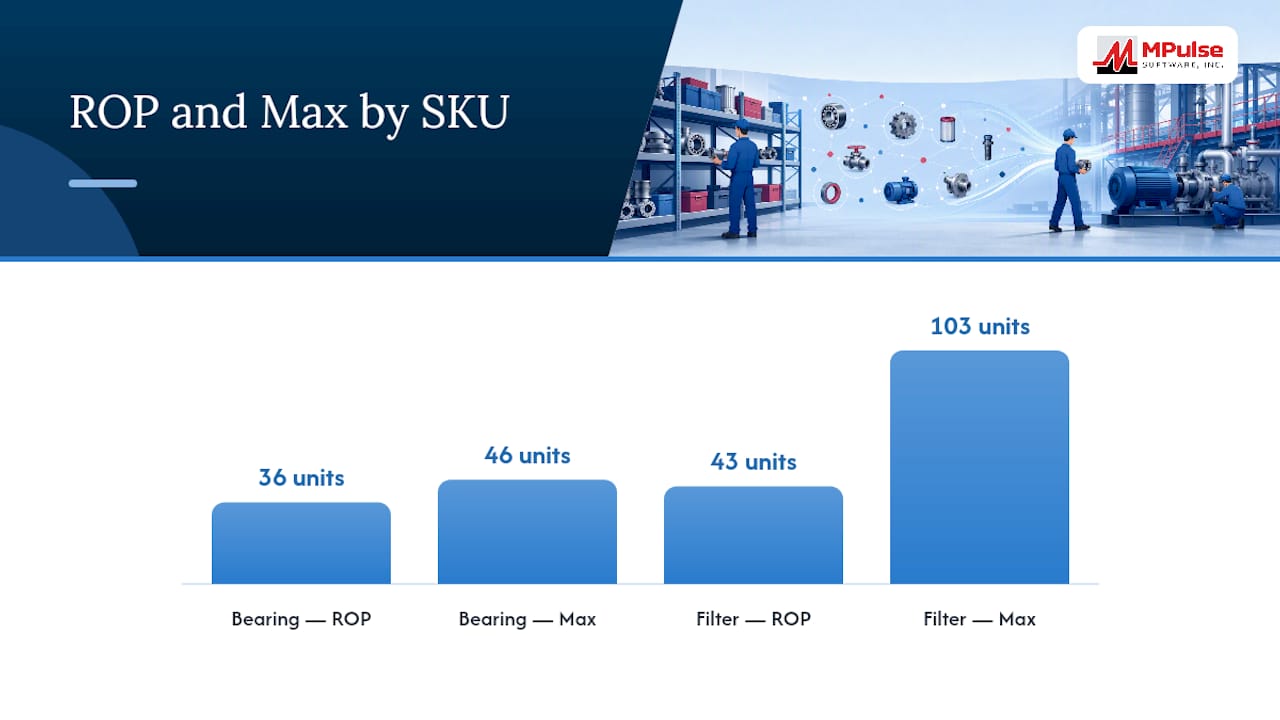
Worked example, faster consumable: A filter averages 4 units per day, 7-day lead time, safety stock set at 15 units using historical spikes. ROP = (4 × 7) + 15 = 43 units. With an EOQ-derived order quantity of 60, Max = 103.
Pro Tip: Run both formulas side by side in your spreadsheet before committing to one. If the statistical result comes in dramatically lower than the simple method, your demand data probably has gaps worth investigating before you trust either number.
Inventory accuracy underpins every input in these equations. Facilities that treat their part records seriously target 83% to 99% accuracy, and they typically hold stockout rates on critical items under 1%. Feed either formula with sloppy usage history and the output looks precise while being wrong.
How to Set and Pilot Min/Max Levels Step by Step
Don’t try to calculate min/max for your entire catalog on day one. Start with a criticality matrix, tier your SKUs by how much downtime or safety risk they carry, and focus your first pass on Tier 2 items: parts important enough to matter but not so mission-critical that a formula error becomes a production-stopping event.
Before running any numbers, pull together:
- Twelve to twenty-four months of usage history per SKU, not just the last quarter.
- Lead time distribution from the supplier, including worst-case delays, not just the quoted average.
- Supplier constraints: minimum order quantities, case-pack sizes, and freight minimums.
- A master-data cleanup pass to merge duplicate part numbers before you calculate anything against them.
Once your pilot list and data are ready, run it for four to six weeks. Track stockout rate on critical items, inventory accuracy, and working capital tied up in the pilot SKUs. If stockouts stay near zero and working capital doesn’t balloon, you’ve validated the formula inputs. If not, adjust safety stock before expanding scope.
Spreadsheets work fine for this pilot stage. Once you’re satisfied with the numbers, a CMMS with part inventory features can automate the reorder trigger itself, generating a purchase requisition the moment on-hand quantity crosses Min, so nobody has to remember to check a spreadsheet on a Friday afternoon.
When Min/Max Isn’t Enough
Min/max assumes fairly steady, predictable demand. It breaks down for capital spares that fail rarely but catastrophically, where a stockout means extended downtime on a single point of failure. That’s where RAM models, which size stock around lifecycle financial risk rather than simple thresholds, do a better job than any reorder-point formula.
Choosing a target service level is a cost trade-off, not a formula. A 99% service level on a low-cost, low-risk part wastes capital; the same target on a spare that halts a production line is cheap insurance. IBM’s Maximo documentation frames this as balancing holding costs against purchasing and stockout costs rather than picking a round number.
A practical way to decide which policy fits which part is a quadrant built on criticality and lead time:
- High criticality, long lead time: safety stock or RAM sizing, not simple min/max.
- High criticality, short lead time: predictive JIT with tight supplier coordination.
- Low criticality, any lead time: two-bin or Kanban systems, where min/max adds unnecessary overhead.
Common Min/Max Mistakes That Cause Stockouts or Excess
Applying one min/max formula across the entire bill of materials is the single most common error. A blanket rule ignores criticality, and it’s how facilities end up simultaneously overstocked on cheap gaskets and out of stock on the bearing that actually stops the line.
Stale inputs are the second failure mode. Usage patterns shift, suppliers change lead times, and a Min calculated two years ago drifts out of relevance. Combine that with duplicate part records, and your KPI reporting becomes unreliable before you even look at the reorder logic. Industry estimates suggest that excess MRO inventory forms a notable share of total stock value, with critical parts facing a concerning stockout risk. These estimates highlight the impacts of data hygiene on inventory management.
Watch supplier minimum order quantities and shelf life on perishable items, both of which can force a Max higher than pure formula math suggests. And not every item needs min/max at all: two-bin systems and Kanban handle low-value consumables more simply, while RAM modeling fits rare, expensive failure points better.
How MPulse CMMS Puts Min/Max Into Practice
Running min/max on a spreadsheet works for a pilot. Scaling it across thousands of SKUs, multiple sites, and rotating staff needs a system that captures usage automatically, fires reorder triggers without manual review, and keeps an audit trail for compliance reporting.
MPulse CMMS handles that operational layer directly, with part inventory management that ties reorder points to purchase requisitions and barcode-driven stock counts that keep on-hand quantities accurate between physical audits.
Facilities using structured preventive maintenance and inventory tracking, including a documented case at Porocel, have reported efficiency gains as high as 40% alongside measurable reductions in unplanned downtime costs.
MPulse Software has supported more than 3,500 customers building this kind of inventory discipline into daily maintenance work.
Considerations for Seasonal Fluctuations in MRO Inventory
Seasonal demand swings break static min/max calculations quietly. A facility running HVAC equipment burns through belts, filters, and refrigerant fittings at a different rate in July than in January, but a Min calculated on a trailing twelve-month average smooths that spike away instead of preparing for it.
The fix is calculating Min and Max on a seasonal basis rather than a single annual average. Split usage history into distinct periods, such as peak cooling season versus shoulder months, and calculate separate reorder points for each. Raise Min ahead of the season you know is coming, not after the first stockout alerts you to it.
Lead time variability compounds the problem during peak seasons, since suppliers facing their own demand surges often extend delivery windows exactly when you need parts fastest. Build that seasonal lead-time creep into your safety stock calculation rather than relying on the average lead time you’d use in a slower month.
Snow-removal equipment parts, agricultural machinery components, and cooling-system spares all show this pattern clearly. A pilot program that only ran during one season risks locking in a Min and Max that look fine for six months and then fail predictably. Review seasonal SKUs on a quarterly cadence at minimum, and treat any part with a documented seasonal pattern as a candidate for a two-tier Min/Max schedule rather than one static number carried year-round.

An Editorial Take on Getting Min/Max Right
Most facilities overcomplicate the rollout and undercomplicate the governance. Start with 50 to 100 SKUs, tiered by criticality, with one person accountable for the numbers. Recalculate quarterly, spot-check monthly, and judge success by service level and criticality coverage, not by how many turns you can squeeze out of the catalog.
— Mark
Automating Min/Max Governance With MPulse CMMS
Manual reorder tracking works until a storeroom clerk goes on vacation or a spreadsheet formula breaks silently. MPulse CMMS closes that gap by tying part records, reorder triggers, and purchase requisitions into one system, so a Min breach generates a requisition automatically instead of waiting for someone to notice a shelf running low.

Before choosing any CMMS for min/max governance, check for three things: does it support criticality tagging on part records, does it generate reorder triggers without manual review, and does it produce audit-ready reporting on stockouts and inventory accuracy. MPulse CMMS covers all three, along with barcode scanning for cycle counts and integration options for existing ERP or sensor systems. Visit the MPulse CMMS software page to see how the platform handles part inventory, reorder automation, and reporting in one workflow, and request a walkthrough tailored to your storeroom’s SKU count and criticality mix.
FAQ
What are minimum and maximum inventory levels?
Minimum is the reorder point, the stock quantity that triggers a new order. Maximum is the order-up-to level, equal to Min plus your reorder quantity.
How do you calculate min/max for MRO parts?
Min equals average daily usage multiplied by lead time in days, plus safety stock; Max equals Min plus your chosen reorder quantity or EOQ.
What is the 80/20 rule in inventory?
It’s the observation that roughly 20% of SKUs, usually your most critical or highest-volume parts, drive a large share of inventory value or usage, which is why criticality tiering should guide where you apply min/max first.
What is min/max used for in inventory management?
Min/max works best for steady-consumption MRO items like filters, belts, and lubricants, where demand is predictable enough that a fixed reorder point and order-up-to level keep stock reliable without constant manual review.
Can a CMMS automate min/max levels?
Yes. A system like MPulse CMMS can tie part records to reorder triggers so a purchase requisition generates automatically once on-hand quantity crosses Min, removing the manual spreadsheet check.