
PM compliance rate measures the share of preventive and predictive maintenance work orders completed on time against the number that were due, following SMRP metric 5.4.14. Below, you’ll find the formula, a worked example, the on-time rules that change your result, and the operational fixes that actually move the number.
TL;DR:
- Maintaining a consistent on-time rule in your CMMS ensures compliance numbers reflect actual performance rather than reporting variability.
- Focusing on high-criticality assets and valid parts stocking can significantly improve compliance and equipment reliability.
- Automating checklist enforcement and overdue alerts in your CMMS prevents manual errors and enforces scheduling discipline.
- A compliance rate above 90% indicates strong scheduling discipline, but it must be paired with outcome metrics like failure rates for true effectiveness.
- Addressing operational issues such as overloading schedules, parts shortages, and reactive work backlog is crucial for meaningful improvement in compliance.
Table of Contents
- What PM Compliance Measures and Why It Matters
- How to Calculate PM Compliance Rate
- On-Time Rules: Why the 10% Rule Changes Everything
- What Counts as a Good PM Compliance Rate?
- What the Number Hides and What to Track Alongside It
- Root Causes of Low Compliance and How to Fix Them
- Proof That CMMS-Driven Compliance Works
- What I’d Prioritize in the Next 30 to 90 Days
- Turn Compliance Tracking Into a Daily Habit, Not a Monthly Scramble
- Sources
- FAQ
What PM Compliance Measures and Why It Matters
PM compliance rate is a work-order count, not a labor-hours calculation. The Society for Maintenance and Reliability Professionals defines PM & PdM Compliance as metric 5.4.14: the number of preventive and predictive maintenance work orders finished by their due date, divided by the number due in that period. That distinction trips up a lot of maintenance teams. A technician can burn 40 hours on PMs in a week and still post a poor compliance score if three of ten scheduled work orders slipped past their deadline.
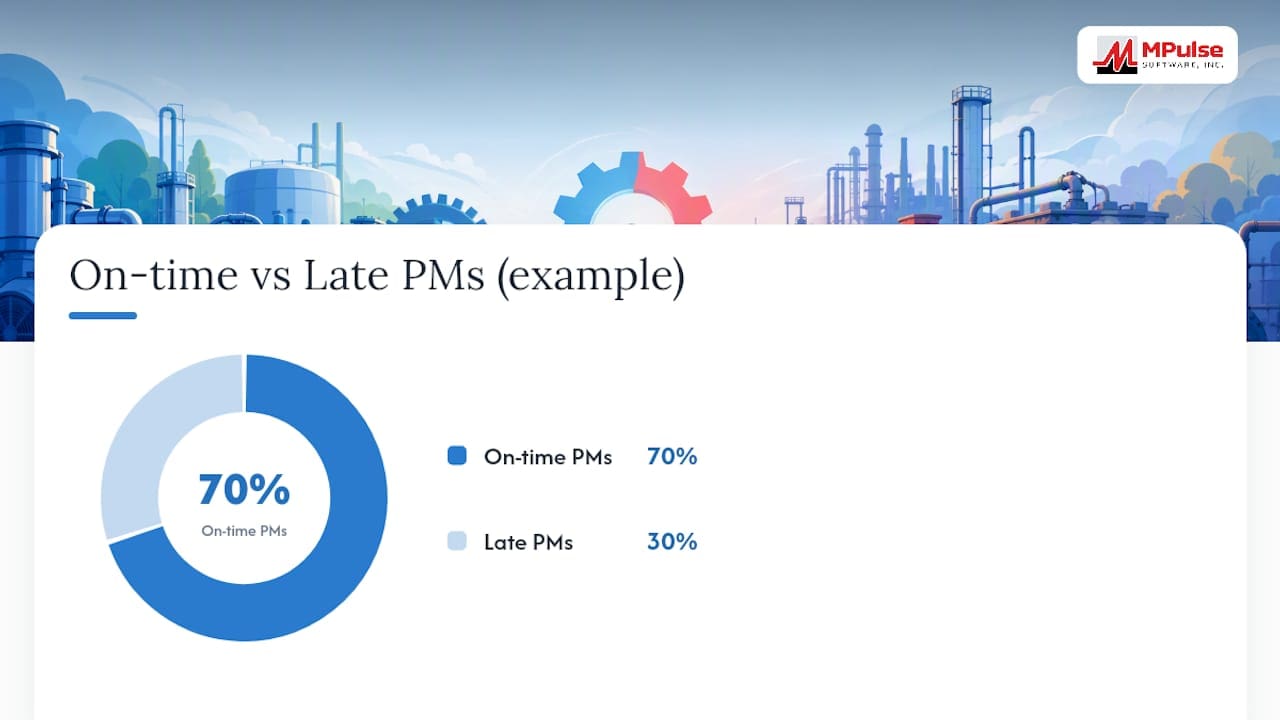
It’s also easy to confuse it with adjacent terms. Schedule compliance measures whether planned work happened in the week it was scheduled, regardless of due date. PM completion just tracks whether the work got done at all, ever. PM compliance is narrower and stricter: it asks whether due work orders closed on time, full stop.
The stakes go beyond a scorecard. Missed PMs on rotating equipment, hydraulic systems, or safety-critical assets raise the odds of unplanned failure exactly where you can least afford it.
- A skipped lubrication PM on a gearbox can shorten bearing life by months.
- Auditors reviewing regulatory or insurance compliance often ask for PM completion records first.
- Planners who can’t trust the compliance number end up padding schedules “just in case,” which wastes labor capacity across the board.
How to Calculate PM Compliance Rate
The formula is simple on paper: (work orders completed on time ÷ work orders due) × 100. The complexity lives in the definitions behind those two numbers.
“Work orders due” means every PM and PdM work order that reached its scheduled due date within the reporting period, whether or not it was ever touched. “Completed on time” means the work order closed within whatever on-time window your organization has adopted, which is the part most teams get wrong.
Here’s a worked example using Sockeye’s calculation approach:
- Your facility had 200 PM work orders due in March.
- Of those, 178 closed within the on-time window you’ve defined.
- Divide 178 by 200, then multiply by 100.
- Your PM compliance rate for March is 89%.
That looks solid until you check what’s hiding inside the count. Watch for these common mistakes:
- Including forward-posted PMs. If a technician closes a PM early and the system auto-generates the next one before it’s actually due, you can inflate the “due” denominator artificially.
- Counting partial completions as done. A work order marked closed with half the checklist skipped still counts as compliant unless your CMMS enforces checklist completion.
- Changing the on-time window mid-quarter. Comparing March’s 20% rule against February’s 10% rule produces numbers that aren’t actually comparable.
On-Time Rules: Why the 10% Rule Changes Everything
The single biggest lever on your reported compliance rate isn’t your maintenance execution. It’s which on-time rule you use to count it.
SMRP outlines three completion criteria for metric 5.4.14:
- Required date only. The work order must close on the exact due date. Strictest option, lowest resulting percentage.
- Required date plus one day. A one-day grace window, common in facilities running multiple shifts.
- Required date plus 20%, capped at 28 days. A weekly PM gets some additional grace; a monthly PM gets several days; anything beyond 140 days caps at a 28-day window regardless of frequency.
Separately, SMRP metric 5.4.10 defines the 10% rule for PM and PdM work order compliance, which applies a similar percentage-of-interval logic but is tracked as its own distinct metric rather than folded into 5.4.14. Conceptually, it answers a related but slightly different question: how much of the scheduling interval itself did you consume before calling the work late.
Sockeye’s research confirms that these rule and counting inconsistencies are among the most common causes of compliance numbers that don’t match reality between sites or over time.
The fix isn’t picking the “right” rule. It’s picking one rule, documenting it, and applying it consistently across every asset and every report, so a change in policy never masquerades as a change in performance.
What Counts as a Good PM Compliance Rate?
ReliaMag’s analysis makes this distinction explicit: it’s the bar SMRP sets for organizations aiming at reliability excellence, not a report card on where most plants actually land. Vendor write-ups tend to use looser banding for context:
- Compliance rates below a certain lower level signal serious scheduling or resourcing breakdowns.
- Moderate compliance levels suggest execution trouble, often tied to parts or capacity issues.
- Higher compliance levels are generally workable, though there’s room to tighten.
- Very high compliance reflects strong scheduling discipline.
Treat these bands as rough orientation, not a certified standard, since no universal benchmark governs them.
Segment your targets by asset criticality rather than applying one number plant-wide. Balance-of-plant equipment can tolerate a looser standard without meaningfully raising your risk profile.
What the Number Hides and What to Track Alongside It
A high PM compliance rate can mask a maintenance program that’s technically compliant and practically ineffective. The metric counts whether a work order closed on time. It says nothing about whether the work was done well, or whether it prevented anything.
Watch for these masking behaviors:
- Logging after the fact. A technician closes yesterday’s PM today and backdates the record.
- Counting partial work as complete. Half a checklist, full credit.
- Quietly shifting the on-time window to make a rough month look better.
- Forward-posting the next PM before the current one is genuinely due, which shrinks the denominator.
Pairing PM compliance with outcome metrics closes that gap. ReliaMag recommends segmenting compliance by asset criticality and tracking it alongside PM & PdM Yield, the ratio of corrective work discovered through PM inspections to total PM hours spent.
Reliability teams generally track compliance alongside backlog growth, failure rates on recently PM’d assets, planned versus reactive labor hours, and MTBF or MTTR trends to confirm that high compliance is translating into fewer surprises, not just cleaner reports.
Pro Tip: Report PM compliance as a rolling 90-day trend line, segmented by asset criticality, instead of a single monthly figure. A trend catches gaming behavior that a snapshot never will.
Root Causes of Low Compliance and How to Fix Them
Three operational problems drive most compliance shortfalls, and none of them are fixed by asking technicians to “try harder.”
Overloaded schedules relative to available labor capacity. When planners schedule more PM hours per week than the crew can physically execute, something has to slip, and it’s usually the PMs that feel least urgent in the moment.
Missing parts and materials at the point of execution. A technician who arrives at the job site without the filter, gasket, or lubricant on hand either delays the work or improvises a shortcut. Either way, the work order stalls.
Reactive work crowding out planned time. Every emergency repair eats hours that were budgeted for scheduled PMs, and reactive work almost always wins the priority fight in the moment.
Here’s a prioritized sequence for addressing all three:
- Build capacity-based schedules. Calculate available wrench-time per week before assigning PM hours, and level the workload across the schedule instead of front-loading it.
- Kit parts in advance. Pull and stage materials for the coming week’s PMs before the work order is released, and set reorder points on high-frequency consumables so stockouts stop derailing the schedule.
- Protect planned PM blocks. Designate specific hours or specific technicians as PM-only, shielded from reactive dispatch except for genuine emergencies.
- Standardize work packages. Build checklists into each PM work order so completion means the same thing every time, regardless of who’s holding the wrench.
- Automate CMMS triggers and escalation. Configure your CMMS to embed compliance checklists and mandatory fields directly into the workflow, flagging overdue work before it slips past the on-time window rather than after.
Measure progress by tracking PM compliance, PM Yield, and failure rates on recently serviced equipment together. If compliance climbs while yield and failures stay flat or worsen, you’re fixing the report, not the reliability problem underneath it. Facilities pursuing similar uptime gains through structured PM discipline have documented results in adjacent industries, including manufacturing shops recovering machine hours through tighter scheduling practices.
Proof That CMMS-Driven Compliance Works
Embedding compliance rules into your CMMS at the planning stage, rather than patching them in during an audit, closes most of the gaps this article has covered. Checklists, mandatory fields, and automatic due-date flags mean the on-time rule gets applied the same way every time, by every technician, without relying on memory or discipline alone.
MPulse Software’s platform supports that approach directly through several capabilities:
- Preventive maintenance automation that generates and tracks work orders against your chosen on-time rule.
- An intuitive calendar interface for visualizing PM load against technician capacity.
- Integration options for pulling in sensor and ERP data to support PdM alongside PM.
- Customizable workflows built for compliance-heavy industries with audit and recordkeeping needs.
Porocel’s maintenance team documented measurable gains after adopting these workflows, detailed in MPulse’s case study. This article was written with input from Mark, whose work on maintenance compliance measurement informs the practical guidance throughout.
What I’d Prioritize in the Next 30 to 90 Days
If I were running a maintenance department trying to fix a shaky compliance number, I wouldn’t start by chasing the percentage itself. I’d start by killing the ambiguity underneath it.
First, lock in one on-time rule, configure it in your CMMS, and annotate every report with which rule generated the number. Second, protect PM windows specifically for A-class assets and track PM Yield for that subset, because that’s where a gamed metric costs you the most. Third, run a genuine 30-day audit of parts availability against your PM schedule and build kitting for whatever gaps you find.
None of these are exciting. All three move the real number, not just the reported one.
— Mark
Turn Compliance Tracking Into a Daily Habit, Not a Monthly Scramble
Most of the fixes in this guide, capacity-based scheduling, parts kitting, protected PM blocks, checklist standardization, only stick when the system enforces them automatically instead of relying on someone remembering to check a box. That’s the gap MPulse Software’s platform is built to close: a CMMS that applies your chosen on-time rule consistently, flags overdue work before it slips, and reports compliance as a trend instead of a guess.
MPulse’s calendar interface and workflow customization let you segment targets by asset criticality without building a separate spreadsheet system on the side, and its reporting tools pair compliance rate with the outcome metrics this article recommends tracking alongside it. If you want to see how that looks against your own PM schedule, take the product tour or start a free trial and run your next reporting period through it directly.
Sources
- PM Compliance Rate Benchmarks: Is 90% the Right Target?
- How to Track, Calculate, and Improve PM Compliance
FAQ
How Do You Calculate PM Compliance Rate?
Divide the number of PM and PdM work orders completed on time by the number due in the same period, then multiply by 100.
What Does PM Compliance Mean?
PM compliance, defined by the Society for Maintenance and Reliability Professionals as PM & PdM Compliance metric 5.4.14, means the percentage of preventive and predictive maintenance work orders that closed by their due date out of all those that were due. It measures scheduling discipline, not whether the work itself improved equipment reliability.
What Is the 10% Rule in PM Compliance?
Facilities should pick one rule set and document it rather than mixing definitions across reports.
What Is the Difference Between PM and PdM?
PM, or preventive maintenance, follows a fixed time or usage-based schedule regardless of equipment condition. PdM, or predictive maintenance, uses condition data such as vibration or temperature readings to trigger work only when equipment shows signs of wear, and a computerized maintenance management system platform supports scheduling and tracking for both approaches side by side.