
Maintenance Pareto analysis finds the small set of failure modes, assets, or cost drivers responsible for most of your downtime or maintenance spend, so your team can prioritize corrective work where it matters most. Start by ranking issues on downtime minutes or cost rather than raw counts alone, then treat the top contributors as immediate root-cause-analysis and preventive-maintenance targets. Pareto tells you where to look. It does not replace the investigation that follows.
TL;DR:
- A Pareto analysis should focus on metrics like downtime minutes or repair cost, not just failure frequency, to identify the most influential issues.
- Grouping and coding consistency significantly affect the accuracy of Pareto charts, making standardized failure categories essential.
- Running a Pareto with multiple metrics side by side helps ensure that the most costly or impactful failures are prioritized over merely frequent ones.
- Regularly updating Pareto charts every quarter, using structured CMMS data, maintains a clear view of evolving failure patterns.
- Corrective actions require root-cause analysis of top contributors, not just reliance on Pareto rankings, to ensure effective resolution.
Table of Contents
- What Is a Pareto Chart and How Does It Apply to Maintenance?
- Why Maintenance Teams Rely on Pareto Analysis
- How to Conduct a Pareto Analysis Step by Step
- Data and Coding Practices That Keep Pareto Honest
- Weighted and Multi-Criteria Pareto for Cost and Risk Priorities
- Turning Pareto Results Into Verified Fixes
- Practical Evidence of Pareto Analysis at Work
- How CMMS Data Capture Makes Pareto Repeatable
- A Practitioner’s Take on Pareto in Maintenance
- Automate Your Pareto Reporting With a CMMS
- FAQ
- Sources
What Is a Pareto Chart and How Does It Apply to Maintenance?
The Pareto principle holds that a small number of causes typically account for most of an effect, often summarized as the 80/20 rule. A Pareto chart turns that idea into a visual: bars ranked from largest to smallest contributor, with a cumulative percentage line overlaid to show how quickly the top causes add up. ASQ describes the Pareto chart as one of the seven basic quality tools, built specifically to rank contributions and make trade-offs visible rather than to prove any process follows an exact 80/20 split.
For maintenance teams, the measurement choice shapes the conclusion. The same failure list can look completely different depending on what you count:
- Failure count: how often each failure mode occurs, useful for spotting chronic nuisance issues.
- Downtime minutes or hours: how long each failure keeps equipment offline, better for operations-focused prioritization.
- Repair or parts cost: total dollars spent per failure category, useful for budget and procurement decisions.
- Lost-production value: the output or revenue impact of each stoppage, often the most persuasive metric for leadership.
Grouping rules matter just as much as the metric. Lumping every electrical fault into one bucket hides which specific failure mode deserves attention, while over-splitting categories dilutes the pattern you are trying to find. The 80/20 split is a heuristic, not a fixed law. Some datasets show 70/30, others 90/10, and the number itself matters less than the fact that a small group of causes dominates the rest.
Why Maintenance Teams Rely on Pareto Analysis
Pareto analysis gives maintenance programs a defensible way to decide what gets attention first, which matters when backlog items, spare-parts budgets, and preventive maintenance schedules all compete for limited labor hours. A downtime Pareto points you toward which assets deserve tighter PM intervals. A cost Pareto flags which repairs are draining the parts budget. A repeat-failure Pareto exposes chronic problems that routine work orders keep patching instead of fixing.
Common ways maintenance teams apply the results:
- Target PM program revisions on the subsystems or assets responsible for the largest downtime share.
- Prioritize spare-parts stocking around the components tied to the costliest or most frequent failures.
- Triage maintenance backlog by working the vital few items before the long tail of minor requests.
- Identify quick wins where a single corrective action resolves a disproportionate share of recurring problems.
One caveat applies across every use case: frequency or cost rank is not the final word. A low-frequency failure with safety, environmental, or regulatory compliance implications can outrank anything sitting higher on the chart, and your prioritization process needs room for that override.
How to Conduct a Pareto Analysis Step by Step
Running a maintenance Pareto analysis follows a repeatable sequence, whether you build it in a spreadsheet or pull it from a CMMS report.
- Scope the analysis. Decide the purpose (reduce downtime, cut repair cost, shrink backlog), the timeframe (a quarter is a reasonable starting point), and the metric (count, downtime, or cost).
- Collect clean data. Pull records with consistent asset IDs, standardized failure-mode codes, and accurate downtime start and stop timestamps. Exclude planned downtime such as scheduled changeovers unless your scope specifically includes it.
- Categorize and subtotal. Group records into failure-mode or asset categories and sum the chosen metric for each one.
- Sort and calculate percentages. Rank categories from highest to lowest, calculate each one’s percentage of the total, then compute a running cumulative percentage.
- Plot the chart. Draw bars for each category in descending order, then overlay a line showing cumulative percentage across the top.
- Interpret the result. Identify where the cumulative line crosses roughly 80%, and treat everything to the left of that point as your vital few: the categories that justify immediate RCA and PM action.
Pro Tip: Build the Pareto with at least two metrics side by side (count and cost, or count and downtime) before committing resources, since the highest-frequency failure is not always the most expensive one.
In Excel, the fastest route is a pivot table summarizing your failure-mode or asset data, followed by Excel’s built-in Pareto chart type (a combo chart of sorted bars with a cumulative line), which handles the percentage math automatically once the pivot table is set up correctly.
A CMMS shortens this path further. When work order records already carry asset IDs, failure codes, and timestamps, you can export a failure-history report straight into a pivot table instead of reconstructing the data from paper logs or scattered spreadsheets. That difference alone often determines whether a Pareto analysis takes an afternoon or a week.
Data and Coding Practices That Keep Pareto Honest
A Pareto chart is only as trustworthy as the records behind it. ASQ’s guidance on Pareto charts stresses that coding discipline determines whether the chart reveals real problems or just documentation habits.
A few rules protect the integrity of the analysis:
- Standardize asset IDs and failure-mode codes before aggregating anything, so the same failure is never recorded three different ways across three technicians.
- Fix downtime start and stop rules in advance, including how to handle intermittent faults or partial-capacity losses.
- Pick one attribution unit (individual asset, subsystem, or work center) and hold it constant across the whole analysis period.
- Separate planned from unplanned downtime explicitly, since blending them skews cost and frequency comparisons.
- Flag chronic partial losses (equipment running at reduced output) separately from full stoppages, since they often hide in the data otherwise.
When records are thin or inconsistent, interview operators and supervisors about likely hotspots, then validate those impressions against a sample of logs before trusting the full dataset. Cross-tab counts by technician or shift can surface coding drift, and comparing maintenance logs against production records catches gaps where downtime went unrecorded.
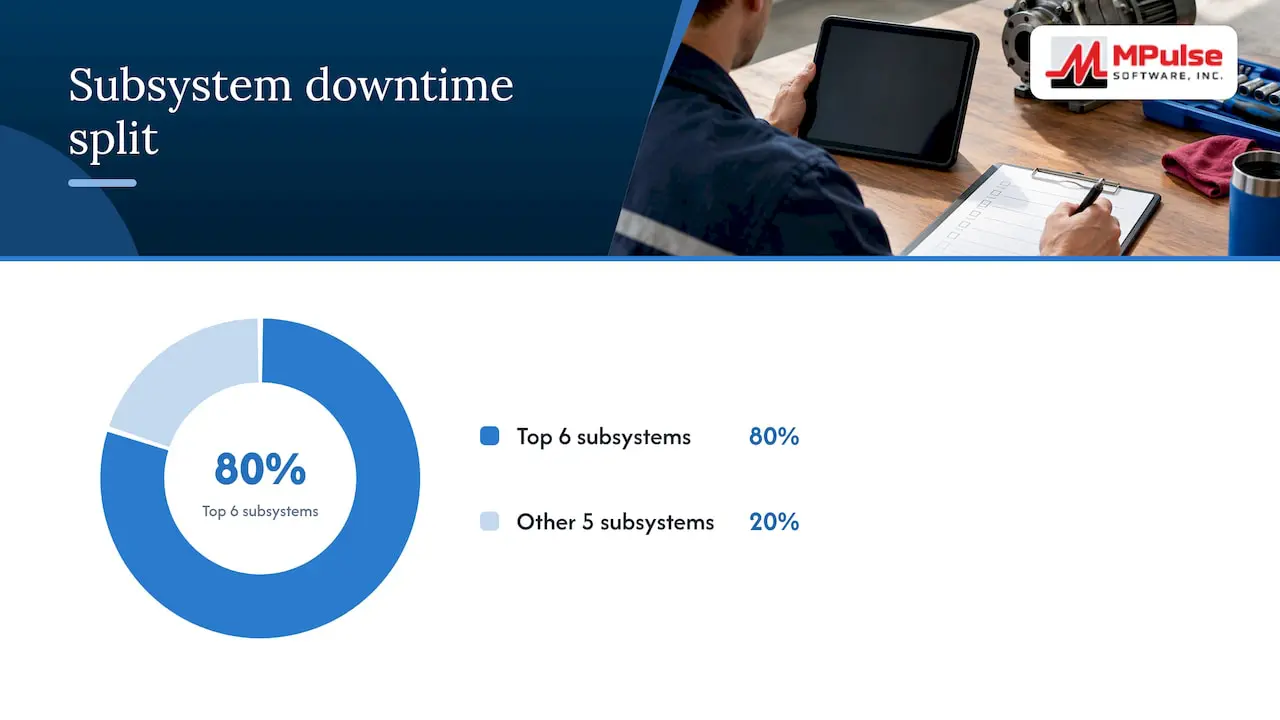
A manufacturing study tracking 18 weeks of breakdown records found that 6 of 11 subsystems accounted for roughly 80% of total downtime, a result the researchers then paired with a hazard-rate model to set subsystem-specific maintenance timing. That level of clarity only came from consistent subsystem coding across the full tracking period.
Weighted and Multi-Criteria Pareto for Cost and Risk Priorities
A frequency-only Pareto can bury the failure that happens rarely but costs the most. A pump that fails twice a year but triggers a four-day production stoppage each time deserves more attention than its low occurrence count suggests, which is where weighted or multi-criteria Pareto variants come in.
A workable approach:
- Normalize each metric (occurrence count, cost, downtime) onto a comparable scale, such as 0 to 100.
- Assign weights reflecting your priorities, for example 40% cost, 30% downtime, 30% occurrence.
- Compute a weighted score for each failure mode by multiplying normalized values by their weights and summing.
- Rank by weighted score instead of raw frequency, and rebuild the Pareto chart around that ranked list.
A 2019 study on failure prioritization proposed ranking failures using cost, occurrence rate, and downtime percentage together, and found this combined approach more robust for maintenance strategy decisions than relying on a single measure. Running frequency and weighted Pareto views side by side, then reconciling where they diverge, gives a clearer picture than either view alone.
Turning Pareto Results Into Verified Fixes
Identifying the vital few is the starting point, not the conclusion. Each top-ranked failure mode needs a structured investigation before you commit resources to a fix.
- Collect evidence on the failure, including when it occurred, under what conditions, and what symptoms preceded it.
- Test possible mechanisms rather than accepting the first plausible explanation, a step ASM International’s failure-analysis guidance treats as essential to avoid misdiagnosis.
- Determine the root cause, distinguishing the failure mode (what happened) from the failure mechanism (why it happened).
- Implement the corrective action, whether that is a design change, a parts substitution, or a revised PM task.
- Verify the outcome by tracking whether the failure actually stops recurring.
Once a Pareto chart has pointed to specific subsystems, pairing it with hazard-rate analysis helps decide maintenance intervals instead of applying the same blanket PM schedule everywhere, a lesson drawn from the same subsystem downtime study referenced earlier. Re-run the Pareto periodically, since fixing today’s top failure mode shifts a different one into its place.
Practical Evidence of Pareto Analysis at Work
Real maintenance data backs up the Pareto pattern repeatedly, though the exact split varies by operation.
- Subsystem downtime: the 18-week manufacturing study found 6 of 11 subsystems responsible for about 80% of total downtime, which directed PM timing decisions toward those specific subsystems rather than the whole machine.
- Multi-criteria prioritization: the cost-based failure study found that combining cost, occurrence, and downtime produced a more reliable priority list than ranking by frequency alone.
- Asset-level concentration: ReliablePlant documents a pulp mill case where 87 items, fewer than 1% of total assets, accounted for 80% of unscheduled downtime, and focusing preventive maintenance on that subset cut downtime by more than half within 18 months.
How CMMS Data Capture Makes Pareto Repeatable
Running a Pareto analysis once proves a point. Running it every quarter requires data that is structured the same way every time, which is where CMMS platforms earn their keep. Fields that matter most for Pareto work include asset IDs, standardized failure codes, downtime start and stop timestamps, cost codes, parts consumed, and labor hours, all captured at the point of work order closeout rather than reconstructed later from memory.
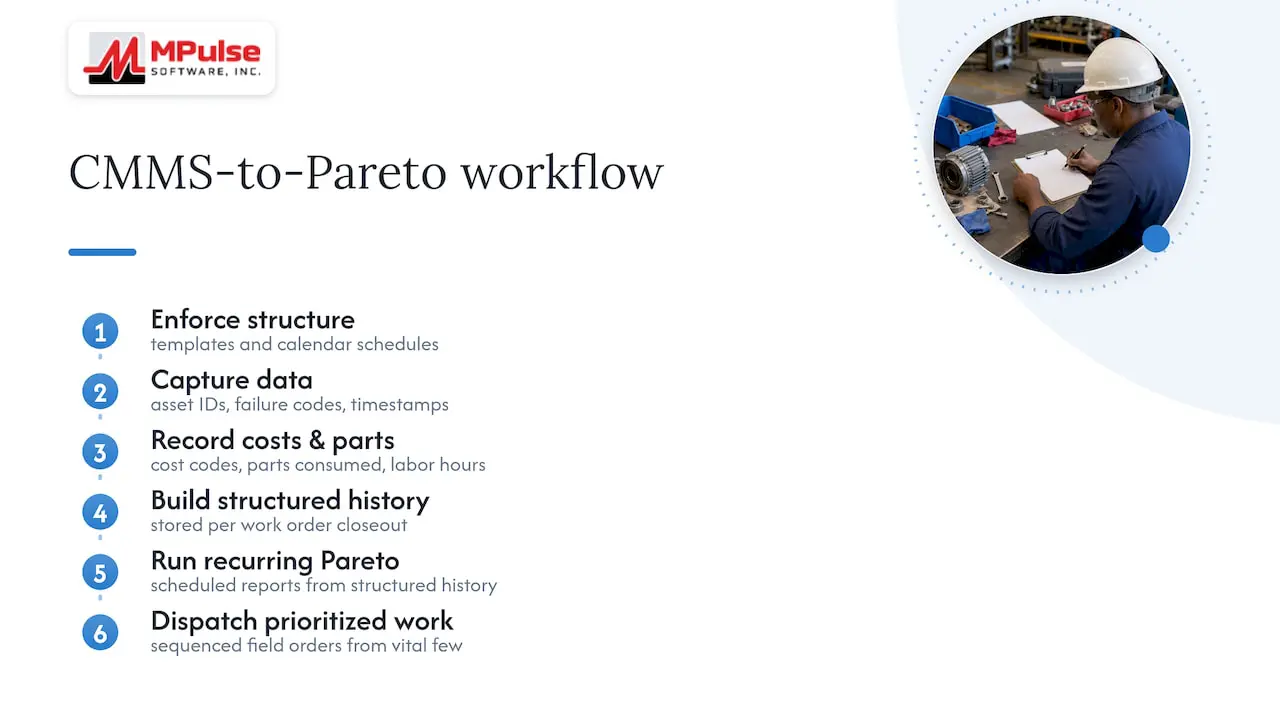
Calendar-based scheduling and work order templates enforce the same coding structure on every technician, which is the single biggest factor separating a usable Pareto dataset from a messy one. Recurring reports pulled straight from that structured history turn Pareto analysis from a special project into a routine check, supporting the kind of preventive maintenance targeting that a one-time spreadsheet exercise rarely sustains. Once prioritized work orders go out, dispatch sequencing matters too. Field service teams facing a similar prioritization problem on the dispatch side can look at how call triage processes decide who gets handled first, a parallel worth considering when your vital few list turns into a work queue.
A Practitioner’s Take on Pareto in Maintenance
Three rules hold up across most maintenance programs: standardize your coding before you trust any chart, run at least two Pareto views (frequency and cost or downtime) before committing resources, and always follow the top items with real root-cause analysis instead of assuming the chart alone justifies action. The most common mistake is treating raw failure counts as the whole story while ignoring criticality or safety exposure. Start small: run a three-month downtime Pareto on one production line, define two or three KPIs to track, then expand once the method proves itself.
— Mark
Automate Your Pareto Reporting With a CMMS
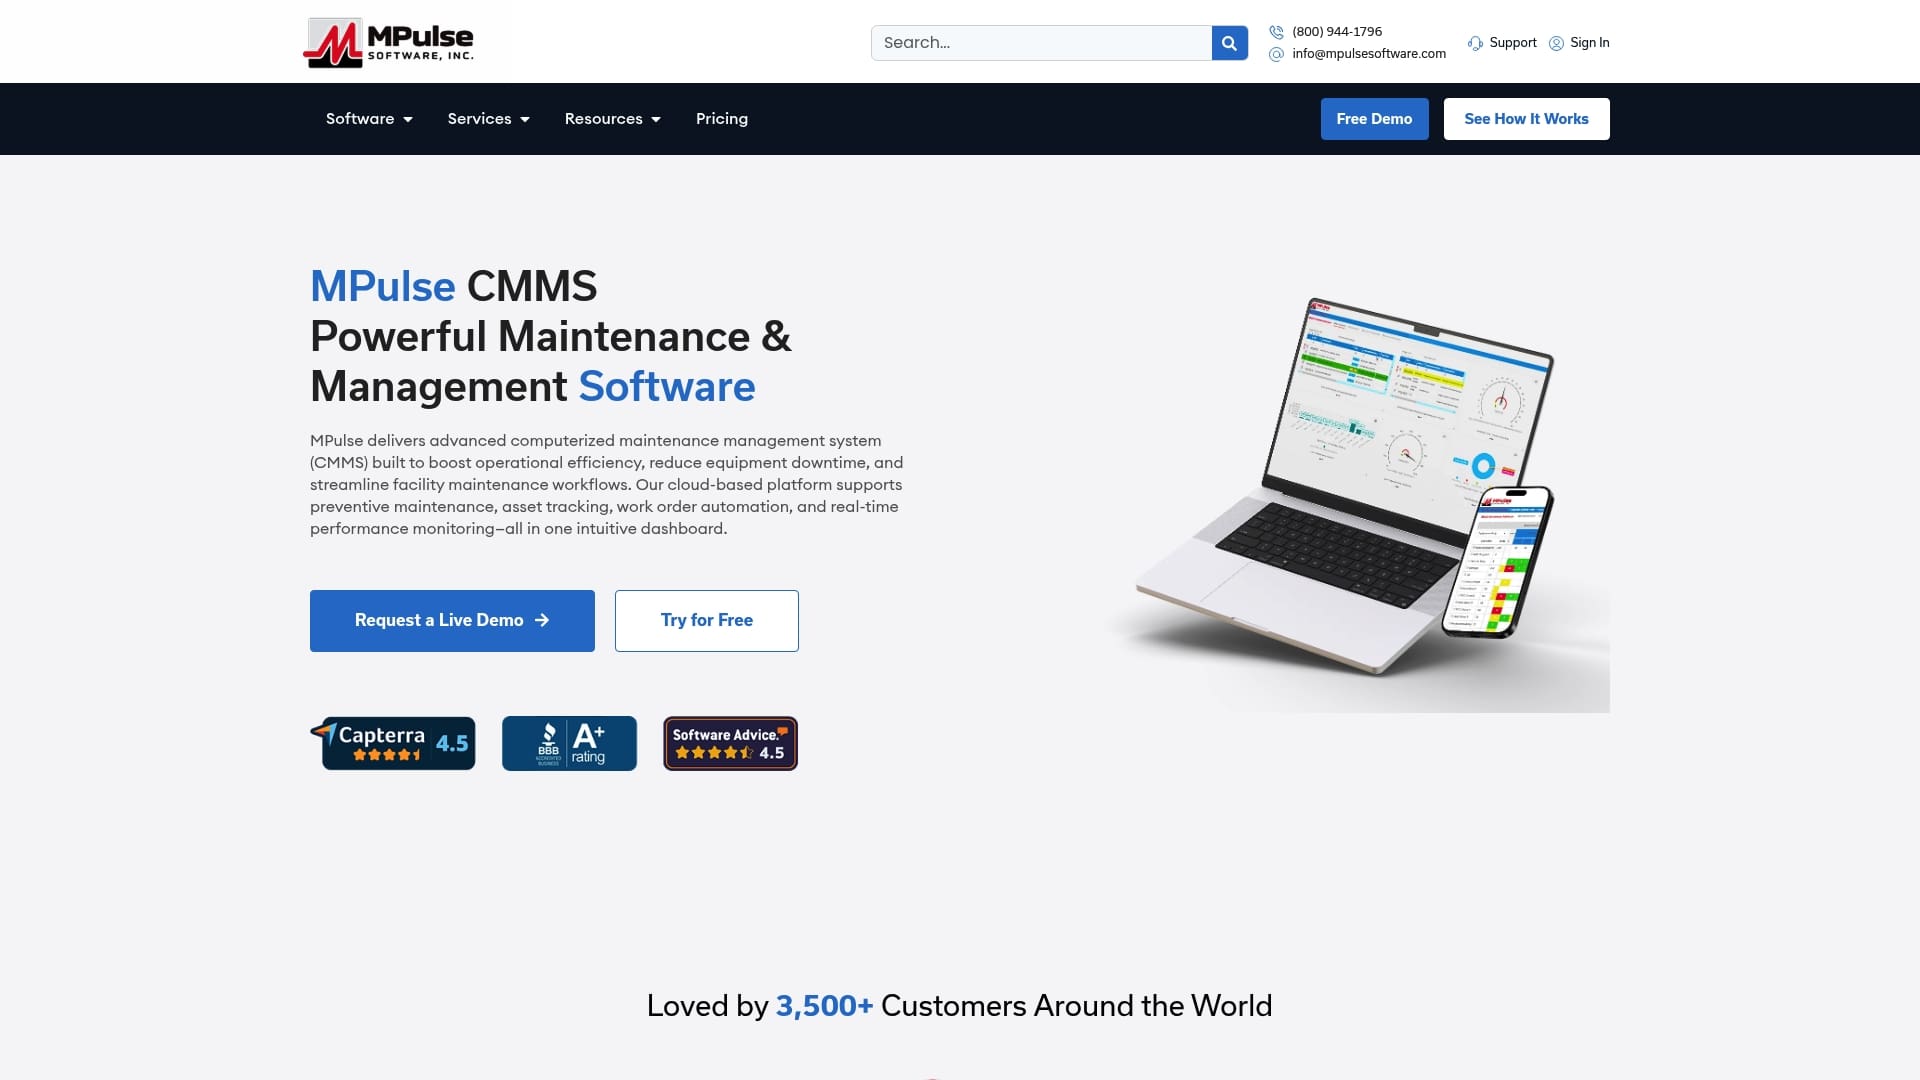
Spreadsheets work fine for a pilot Pareto analysis, but scaling the approach across multiple lines or facilities means pulling clean data manually every quarter, which gets tedious fast. We built MPulse CMMS to capture the asset IDs, failure codes, and downtime timestamps a Pareto analysis needs at the point of work order closeout, so the reporting step becomes a pull instead of a reconstruction project.
- Recurring reports replace manual exports once your failure coding is standardized in the system.
- Calendar-based scheduling keeps PM intervals aligned with whatever the Pareto results point to.
- Flexible plans, including Professional at $29 per month per user and Advanced at $79 per month per user, scale from a single-site pilot to a multi-facility rollout.
If your team is ready to move past spreadsheet pivot tables, explore MPulse pricing to see which plan fits your current maintenance data volume.
FAQ
What is the 80/20 rule in a Pareto chart?
The 80/20 rule suggests that roughly 80% of effects come from about 20% of causes, though the exact split varies by dataset. In a Pareto chart, this shows up as a cumulative percentage line that climbs steeply across the first few bars and flattens out across the rest.
What is a Pareto chart in quality?
A Pareto chart is one of the seven basic quality tools, combining ranked bars with a cumulative percentage line to show which causes contribute most to a problem. Quality teams use it to focus limited resources on the few causes responsible for the bulk of defects or failures.
What is the Pareto Principle and how does it apply to operations management?
The Pareto Principle holds that a minority of causes typically drive the majority of outcomes, whether that is defects, downtime, or cost. In operations management, it guides teams toward prioritizing the handful of assets, failure modes, or process steps responsible for most disruptions rather than spreading effort evenly across every issue.
What does the Pareto principle 80/20 rule suggest in terms of time management?
Applied to time management, the 80/20 rule suggests that a small portion of tasks or activities typically produces most of the meaningful results. The practical takeaway is to identify which few tasks carry the most impact and prioritize those before tackling the longer list of lower-value items.
How often should a maintenance team repeat a Pareto analysis?
There is no fixed interval, but repeating the analysis each quarter or after major corrective actions catches shifts as previously top-ranked failures get resolved and new ones emerge. Teams using a CMMS with recurring report templates can run the comparison without rebuilding the dataset each time.
Sources
- The Pareto principle and a hazard model as tools for appropriate scheduled maintenance in a manufacturing firm – SUNY Research Connect
- A cost-based failure prioritization approach for selecting maintenance strategies for thermal power plants
- What is a Pareto chart? | ASQ
- Failure analysis subject guide | ASM International