
A maintenance benchmark is only useful when two things are true: your metrics are defined the same way as the numbers you compare them to, and the peers you compare against look like your operation. Get those two right and a short set of metrics (cost against asset value, MTTR, MTBF, PM compliance, planned work share and backlog) will show where downtime and spend are leaking. A CMMS (computerized maintenance management system) makes this practical because the data comes from work orders instead of memory.
This guide covers the metrics worth benchmarking, how each is calculated, where published benchmarks come from and how to read them fairly. It also shows how to lay out a maintenance dashboard that people act on.
TL;DR
- Benchmarking has two steps: measure with standard definitions, then compare against a deliberately chosen peer group of similar size, region or specialty.
- Start with six to ten metrics: cost against asset value, MTTR, MTBF, PM compliance, planned versus reactive work, backlog and schedule compliance.
- Your numbers are only as good as your work order data. Incomplete records produce misleading benchmarks.
- A useful dashboard is one page, with a few weighted or grouped measures, trends over time and a clear owner for each number.
- Internal benchmarking (site against site, crew against crew, this year against last) is the fastest place to start.
Table of Contents
- What maintenance metrics and KPIs measure
- The core maintenance performance metrics and how to calculate them
- Benchmarking in two steps
- Start with internal benchmarks
- Your data quality sets the ceiling
- What a maintenance dashboard should show
- From metrics to lower downtime and cost
- Promo: put the metrics on a calendar your team uses
- Perspective: benchmark yourself first
- FAQ
- Sources
What maintenance metrics and KPIs measure
A metric is any number you can calculate from maintenance records. A KPI (key performance indicator) is a metric tied to an objective that matters. The international standard ISO 22400-1 defines a KPI as a quantifiable level of achieving a critical objective, as quoted in a 2018 NIST/ASME paper. That paper also notes that no standardized set of maintenance KPIs existed when it was written, which is why the same label can mean different things in different organizations.
For a facility manager, that has a practical consequence. “Downtime” may include planned shutdowns in one plant and exclude them in another. “Maintenance cost” may include contractor invoices at one hospital and leave them out at the next. Before you benchmark anything, write down what goes into each number.
Most maintenance metrics answer one of four questions:
- Are assets reliable? (MTBF, unplanned downtime, failure counts)
- Is work done quickly and on schedule? (MTTR, schedule compliance, backlog)
- Is the mix of work healthy? (planned versus reactive, PM compliance)
- Is the money well spent? (cost against asset value, cost per square foot, parts inventory turns)
The core maintenance performance metrics and how to calculate them
The formulas below are the common ones. Whichever definition you adopt, keep it fixed so your trend lines mean something.
| Metric | Formula | What it tells you |
|---|---|---|
| MTBF (mean time between failures) | Operating time ÷ number of failures | How reliable an asset or asset class is |
| MTTR (mean time to repair) | Total repair time ÷ number of repairs | How fast you restore function after a failure |
| PM compliance | PM work orders completed on time ÷ PM work orders scheduled | Whether preventive work actually happens |
| Planned maintenance percentage | Hours on planned work ÷ total maintenance hours | How much of your effort is proactive |
| Schedule compliance | Scheduled jobs completed in the period ÷ jobs scheduled | Whether crews follow the plan |
| Backlog | Estimated hours of open, ready work ÷ weekly crew capacity | How many weeks of work are waiting |
| Cost of service ratio (COSR) | Annual maintenance cost ÷ equipment acquisition cost | How maintenance spend compares to asset value |
Reliability: MTBF and unplanned downtime
MTBF only makes sense for repairable assets and only when failures are recorded consistently. A pump that fails twice in 4,000 operating hours has an MTBF of 2,000 hours. Track it by asset class, not facility-wide, because averaging a chiller with a door closer tells you nothing.
Pair it with unplanned downtime hours per asset. Together they show which equipment drives your losses and where preventive tasks should be tightened.
Speed: MTTR and backlog
MTTR rises when parts are not on the shelf, when technicians wait for approvals, or when procedures are unclear. If MTTR is high on one asset class, look at parts availability and job instructions before you blame the crew.
Backlog expressed in weeks is easier to compare than a raw count of open work orders. A backlog that grows month after month means demand is outpacing capacity, whatever the headcount says.
Work mix: PM compliance and planned versus reactive
PM compliance measures discipline. Planned maintenance percentage measures the result of that discipline. A site can post 95% PM compliance and still spend most of its hours on emergencies if the PM tasks are the wrong ones. Read the two together.
Cost: COSR and cost per square foot
The AAMI HTM Benchmarking Guide recommends calculating COSR as annual maintenance cost divided by equipment acquisition cost, and it is useful well beyond healthcare because it normalizes for how much equipment you own. In buildings, cost per gross square foot plays the same role.
Benchmarking in two steps
The AAMI guide frames benchmarking as two separate steps: first measure your performance using standard definitions, then compare it against a peer group you choose on purpose, by facility size, geography or specialty. Its example is that comparing a pediatric hospital with general biomedical programs would mislead.
That applies in every sector. A 40-bed rural hospital, a university with 60 buildings and a high-volume packaging line each need their own peer set.
Where published benchmarks come from
These are the sources worth knowing, with the caveat that each is dated and each has its own definitions:
- SMRP Best Practices, Metrics & Guidelines. The Society for Maintenance & Reliability Professionals standardizes 70+ maintenance and reliability metrics. Each entry gives a definition, formula, sample calculation, best-in-class target and cautions about harmonizing data. It is the best place to settle your definitions.
- Operations & Maintenance Benchmarks survey. The 2016 update drew on 2,193 surveys covering more than 98,000 US buildings across services, manufacturing and institutional sectors, with federal data on more than 800 GSA facilities. Canadian costs were converted to US dollars at the December 31, 2016 rate, a reminder to check currency and year before using any cost figure.
- ASHE/IFMA hospital benchmarks. This report from 2008 listed best-in-class (95th percentile) total maintenance cost of $12.66 per gross square foot, with building systems at $3.47. Those dollars are more than a decade and a half old. Use the structure of the report, not the figures, for a current budget.
- Heavy Equipment Comparator. The CFMA summary describes 32 KPIs in nine categories: inputs such as labor and inventory efficiency, outputs such as utilization and reliability, and processes such as planning, preventive maintenance and safety. Fifty-seven companies contributed data, which makes it a useful template for contractors and equipment-heavy fleets.
Reading benchmarks without fooling yourself
The ASHE report itself warns that self-reported data collected under different accounting and measurement practices cannot give a perfect comparison. It also notes that lowest cost does not always mean best practice: a hospital scheduled for demolition spends little on maintenance for good reason.
Four habits keep comparisons honest:
- Match the definition. Confirm what labor, contractor spend, parts and overhead are included.
- Match the peer group. Size, age of assets, climate, regulatory load and shift pattern all change the result.
- Read cost with reliability. A low cost per square foot alongside rising unplanned downtime is deferred maintenance, not efficiency.
- Watch the trend. Your own movement over 12 months is often more telling than a gap to an outside average.
Start with internal benchmarks
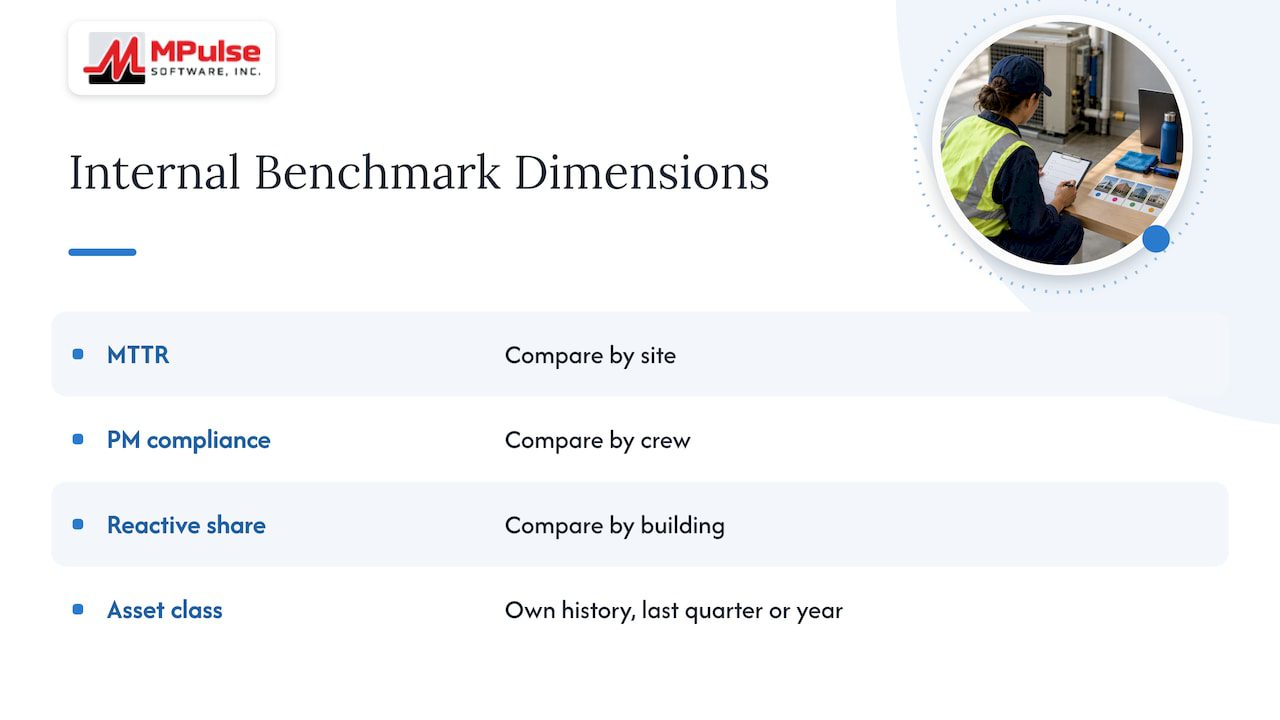
Outside surveys take effort to match. Internal comparison does not. If you manage several buildings, plants or campuses, compare them on the same definitions: MTTR by site, PM compliance by crew, reactive share by building. The best performer’s routines become a template for the others. You can also compare each asset class with its own history from last quarter or last year.
This only works if every site records work the same way. Our guide to creating reasonable benchmarks walks through setting targets that fit your own operation.
Your data quality sets the ceiling
The NIST/ASME paper points out that technicians may record work order information informally or not at all, which creates inconsistencies and inaccuracies that undermine maintenance decisions. Any benchmark built on those records inherits the problem.
The fixes are mostly process:
- Require a failure or problem code and a completion date and time on every work order.
- Record labor hours against the right asset, not against a generic line.
- Close work orders the day the work finishes, so MTTR is not inflated by paperwork delay.
- Keep one asset register, with consistent naming, so failures roll up to the right class.
A CMMS with mobile access and barcode scanning makes these habits easier because the technician records the job at the asset. MPulse supports mobile devices and barcode scanning, along with work order management and asset tracking.
What a maintenance dashboard should show
More metrics do not mean more insight. A good dashboard answers three questions in under a minute: how are we doing, where is the problem, and who owns it.
Examples of dashboard structures
One well-known approach is the Maintenance Excellence Index described by Pete Peters in Plant Maintenance. It combines 10 to 15 weighted KPIs on a one-page spreadsheet into a single composite score out of 1,000, after reviewing 21 candidate metrics. The article is from 2002, but the idea holds: pick a few measures, weight them by importance and show one score with its components.
Three dashboard layouts cover most facility teams:
| Dashboard | Audience | Typical contents |
|---|---|---|
| Executive summary | Operations director, CFO | Cost against budget, cost per square foot or COSR, unplanned downtime trend, backlog in weeks |
| Supervisor view | Maintenance supervisor | PM compliance, schedule compliance, overdue work orders, labor hours by crew |
| Asset reliability view | Reliability engineer, plant manager | MTBF and MTTR by asset class, top 10 assets by downtime, repeat failures |
Design principles
- Limit it to one page. If you must scroll, you have too many measures.
- Show a trend, not just today’s value. A line over 12 months beats a single number.
- Pair metrics that can mislead alone. PM compliance with planned work share; cost with downtime.
- Give every metric an owner and a target. A number nobody owns does not change.
- Filter by site, crew and asset class. The problem is almost always in one slice.
- Use OEE selectively. The Peters approach reserves overall equipment effectiveness for mission-critical production assets rather than pure facilities operations. In a hospital or school, it rarely belongs on the main page.
Our article on how to measure maintenance performance KPIs with software goes deeper on setting these measures up, and the facility maintenance KPIs guide lists the measures by facility type.
From metrics to lower downtime and cost
Metrics pay off only when each one triggers an action. A simple review rhythm works:
- Weekly: review backlog, overdue PMs and schedule compliance with the crew leads.
- Monthly: review MTTR and MTBF by asset class and pick the two worst performers for a root cause review.
- Quarterly: review cost against budget and COSR, and decide whether PM intervals need to change.
- Annually: re-select peer groups, check that definitions still hold and reset targets.
A worked example: a campus facilities team sees unplanned downtime concentrated in air handlers. MTTR is acceptable, but MTBF is low and repeat failures cluster on one belt and bearing set. The response is a revised PM task list and stocking those parts, not more technicians. Next quarter’s MTBF shows whether the change worked.
By sector, the emphasis shifts:
- Manufacturing: MTBF, MTTR and unplanned downtime on production assets, with OEE where it fits.
- Healthcare: COSR, PM compliance and the documentation that supports audits.
- Education: cost per square foot, backlog and work order response across many buildings.
- Contractors: schedule compliance, labor utilization and cost per job.
Promo: put the metrics on a calendar your team uses
MPulse CMMS combines preventive maintenance automation, work order management, asset tracking, calendar scheduling, parts inventory and graphical reporting, so the numbers in this guide come from the same records your technicians already update. Over 3,500 customers use MPulse, and our customers report efficiency improvements of up to 40%.
The Professional plan is $29 per month per user and the Advanced plan is $79 per month per user; see the pricing page for what each includes. If you want help setting up asset records and PM schedules so your first benchmarks are reliable, look at our implementation, training and consulting services. The Resource Planning Dashboard is available as an add-on.
Perspective: benchmark yourself first
Most teams we talk with want an outside number before they trust their own. We would start the other way around. Agree on your definitions, make sure every work order carries a complete record, and let your own trend show you where the leaks are.
An external benchmark answers “how do we compare?” Your internal data answers “what do we fix on Monday?” The second question is worth more, and it is the one a CMMS is built for. When PM scheduling, work orders, parts and reports live in one system, MTTR, backlog and PM compliance stop being a monthly spreadsheet exercise and become something a supervisor can open in the morning.
That is why we designed MPulse around an intuitive calendar interface, graphical reporting and integrations with ERP and sensor systems. Compliance-heavy operations such as hospitals and regulated manufacturers also need the records behind the numbers, and the platform supports compliance and regulatory recordkeeping. Our advice: choose a few metrics, track them consistently for a year and compare against peers once your own data is clean.
Mark
FAQ
What does KPI stand for in maintenance?
KPI stands for key performance indicator. ISO 22400-1 defines it as a quantifiable level of achieving a critical objective. In maintenance, that means a number such as MTTR or PM compliance that is tied to a goal like less downtime or lower cost.
How many maintenance metrics should I track?
Start with six to ten. The Maintenance Excellence Index approach uses 10 to 15 weighted KPIs on one page. Add more only when you have an owner and an action for each one.
How do I choose peers for a maintenance benchmark?
Select them by facility size, geography or specialty, as the AAMI benchmarking guide recommends. Confirm that they define cost and downtime the way you do. If you cannot find a close match, compare your own sites and your own history.
Is the lowest maintenance cost the best benchmark?
No. A low cost can mean deferred work. The ASHE report notes that a facility scheduled for demolition spends minimal resources for good reason. Read cost together with downtime, backlog and PM compliance.
What should a maintenance dashboard include?
Keep it to one page: cost against budget, unplanned downtime, backlog in weeks, PM compliance and MTTR or MTBF for your most critical asset classes. Show trends over time, assign an owner to each number and filter by site or asset class.
Sources
- NIST/ASME paper MSEC2018-6492 on maintenance KPIs and work order data
- AAMI HTM Benchmarking Guide, 2nd edition
- Operations and Maintenance Benchmarks survey extract
- ASHE hospital operations and maintenance benchmarks report
- SMRP Best Practices, Metrics & Guidelines
- Maintenance Excellence Index, Plant Maintenance
- Heavy Equipment Comparator executive summary, CFMA