
MTBR, or mean time between repairs, is the average amount of operating time that passes between repair events on an asset or a group of assets. To track it, you count genuine repairs over a defined period, divide the population’s operating time by that count, and trend the result month after month. The hard part is not the arithmetic. It is keeping repair records clean enough that the number means something.
This guide covers the formula, the data you need, how MTBR differs from MTBF, the mistakes that distort it, and how a CMMS makes the tracking routine.
TL;DR
- MTBR is the average operating time between repair events. A rising trend means repairs are becoming less frequent.
- The basic calculation is the asset population divided by the number of repairs in the period, expressed in the period’s time unit.
- MTBF counts failures. MTBR counts repair activity, so planned work can count only when it restores equipment to a working condition.
- Small populations and short periods swing the number sharply. Use a six- or twelve-month rolling average.
- Tracking depends on work orders that separate real repairs from inspections, lubrication and other routine tasks.
Table of Contents
- What MTBR means in maintenance
- How to calculate MTBR
- What data you need
- MTBR vs. MTBF
- Limits of MTBR you should plan for
- Using MTBR trends to cut downtime
- Tracking MTBR for vehicles and mobile equipment
- How a CMMS makes MTBR tracking routine
- Our perspective on MTBR
- Put MTBR tracking into practice with MPulse
- FAQ
- Sources
What MTBR means in maintenance
Mean time between repairs measures how long, on average, a machine or a class of machines runs before it needs to be repaired again. Maintenance and reliability teams use it to judge whether a population of equipment is getting more or less demanding of shop and technician time.
The metric is most established in rotating equipment, especially pumps, where reliability programs have used it for years to compare plants, pump classes and service conditions. The Hydraulic Institute notes that MTBR includes downtime associated with failures, planned maintenance and other repair events, which is why it reflects the real burden on a maintenance team better than a pure failure count.
The same logic applies well beyond pumps. Motors, HVAC units, conveyors, vehicles and production lines all produce repair histories. If you can count the repairs and know how long the assets ran, you can calculate MTBR.
How to calculate MTBR
Pumps & Systems gives a population-based version of the formula: MTBR equals N divided by R, where N is the number of machines in the population and R is the number of repairs during the measurement period. The result is expressed in the time unit of the period you chose.
The per-asset version is equivalent: total operating time divided by the number of repairs.
MTBR = total operating time ÷ number of repairs
A worked example
This is an illustration, not a benchmark. A plant runs 40 centrifugal pumps. Over twelve months, maintenance logs show 25 work orders that restored a pump to working condition.
- Population (N): 40 pumps
- Period: 12 months
- Repairs ®: 25
- MTBR = 40 ÷ 25 = 1.6 years, or about 19 months
Now suppose a reliability project cuts repairs to 16 the following year. MTBR becomes 40 ÷ 16 = 2.5 years, or 30 months. The population needs repair attention far less often, and you can show the change in a single figure.
Operating hours versus calendar time
Calendar time works for equipment that runs continuously. For anything with variable duty, such as vehicles or seasonal equipment, operating hours or cycles are fairer. A U.S. Department of Energy report on FedEx Freight electric-hybrid trucks, for example, recorded MTBR in operating hours, including an average of 455 hours from February 2012 through September 2013 across a fleet of 40 power units. Equal calendar months would have hidden the difference between a truck that idled and one that ran daily.
What data you need
Three data points drive every MTBR calculation:
- A clean asset register. Each asset needs a unique ID, a class (for example, centrifugal pumps, rooftop units) and an in-service date, so you can define the population correctly.
- Repair events with dates. Each repair needs a work order that records the asset, the date, the work performed and the cause.
- Run time or usage. Meter readings, runtime hours or, at minimum, confirmation that the asset was in service for the full period.
The key discipline is separating actual repairs from other work orders. Pumps & Systems advises tracking repairs over a defined period and distinguishing actual repairs from other work orders. A lubrication route, a filter swap and a vibration reading are maintenance, but they do not restore a failed or degraded component. If they land in your repair count, MTBR falls and the trend misleads you.
A simple coding scheme
Most teams solve this with work order types and failure codes:
| Work order type | Counts toward MTBR? | Example |
|---|---|---|
| Corrective repair | Yes | Replace a failed bearing |
| Emergency repair | Yes | Seal leak shuts down the line |
| Planned repair that restores condition | Yes | Rebuild scheduled after inspection finds wear |
| Routine preventive task | No | Lubrication, filter change, inspection |
| Modification or upgrade | No | Install a new controller |
The planned-repair row is the one that causes arguments. The reliable rule is the one in the Pumps & Systems comparison: planned activities count only when restoration work is required. Write the rule down, apply it to every site, and never change it midyear.
MTBR vs. MTBF
The two metrics sound alike and are often confused. They answer different questions.
| MTBF | MTBR | |
|---|---|---|
| Counts | Failures | Repair events |
| Question answered | How long does the equipment perform within limits? | How often does the equipment need repair work? |
| Planned work | Not counted | Counted only when restoration is required |
| Sensitive to | Failure definition | Repair-event interpretation and how fast your team responds |
Per Pumps & Systems, MTBF reflects the mean life during which all parts perform within specified limits, while MTBR reflects the mean life between the repair activities needed to restore them. For a deeper look at the failure side, see our guide on what mean time between failures means for your team.
In practice, MTBR is usually the more useful number for a maintenance manager, because repairs are what consume labor, parts and downtime. MTBF is more useful for design and procurement comparisons.
A caution on MTBF assumptions
MTBF is a mean, not a guarantee. U.S. Department of Defense reliability guidance states that reliability is a probability of performing without failure for a specified period, while MTBF is a mean time between failures rather than a probability. It also cautions that treating MTBF as the inverse of failure rate holds only under a constant-failure-rate assumption, and that equipment in wear-out needs hazard-rate analysis. If your assets are aging, do not read any mean-time figure as a prediction of when the next event will occur.
Limits of MTBR you should plan for
Small populations swing widely
If you have six pumps and two extra repairs happen in one quarter, MTBR can fall by a third. Pumps & Systems notes that small populations or short periods cause large fluctuations and suggests a six- or twelve-month rolling average to smooth them. Report the repair count alongside the figure so readers can see how thin the data is.
MTBR can be flattered by slow response
The same source warns that MTBR may be inflated because it can include equipment life plus the time your organization takes to identify, plan and repair an issue. A team that defers repairs will see longer intervals without any improvement in the equipment. Pair MTBR with backlog age and downtime hours.
Do not compare unlike assets
A chiller and a sump pump should not share a benchmark. Compare within classes and duty conditions, and calculate the metric the same way every time. Operating conditions matter: a 2026 peer-reviewed study of 675 refinery pumps found that maintenance work orders were the most influential predictor of MTBF, followed by operating variables such as pumped fluid, discharge pressure and manufacturing year. Work-order history carries real signal, but only if it is recorded consistently and read alongside operating conditions.
Using MTBR trends to cut downtime
A single MTBR figure is a snapshot. The value comes from the trend and from the drill-down underneath it.
- Trend by asset class. Plot rolling MTBR monthly. A downward slope tells you a class is consuming more repair effort, even before any single failure becomes serious.
- Rank repeat repairs. Sort repair work orders by asset and failure code. If three assets account for a third of repairs, start there.
- Check the cause codes. Repeated seal or bearing repairs often point to alignment, lubrication or operating practice, not bad parts.
- Test a change, then re-measure. After you adjust a preventive maintenance interval or fix a root cause, watch MTBR over the next six to twelve months.
- Connect to downtime. Multiply repairs by average hours down to see what each class costs in lost production. Our guide on how to calculate downtime shows the method.
On the maintenance side, the Hydraulic Institute points out that condition monitoring gives early indications of problems and supports planning, although condition monitoring alone does not improve MTBR. The improvement comes from acting on what the monitoring finds. That is why a condition-based maintenance workflow, where a reading triggers a work order, matters more than the sensor.
Better scheduling also helps. Moving from reactive repair to planned intervals is the usual route to longer intervals between repairs, and our article on smart maintenance scheduling explains how planners reduce unplanned stops.
Tracking MTBR for vehicles and mobile equipment
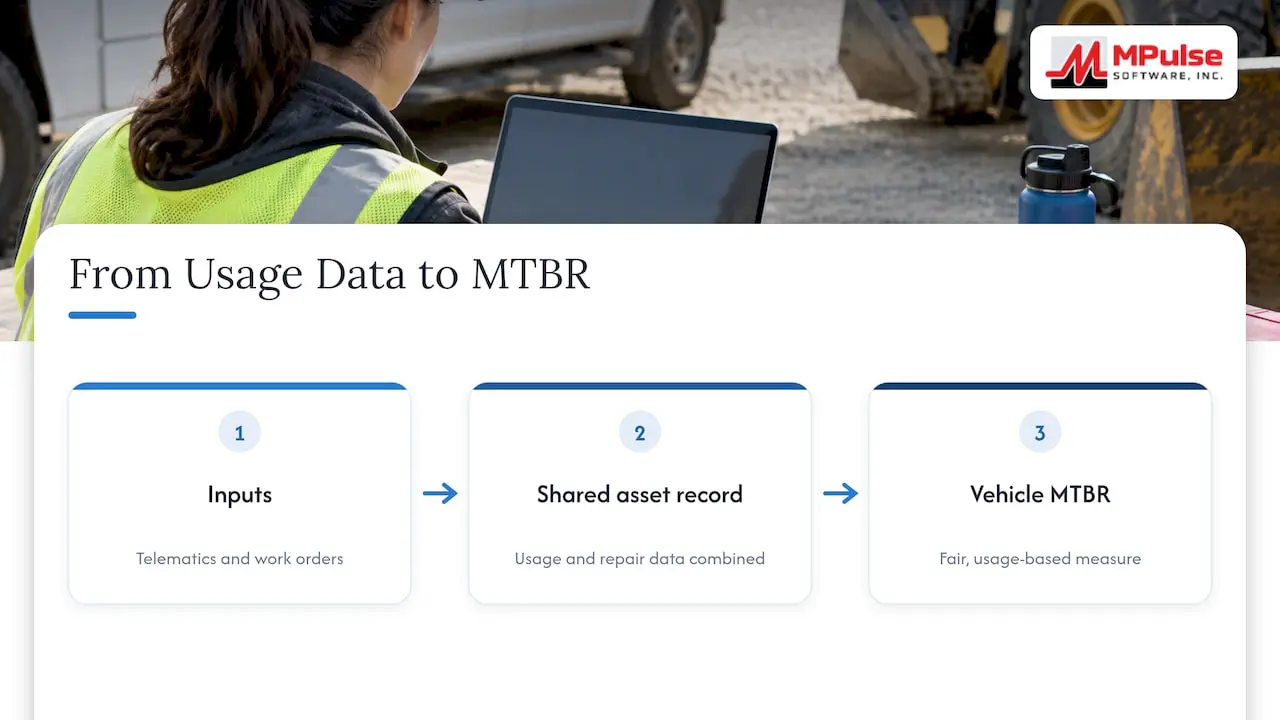
Fleets and mobile assets add a wrinkle: usage varies by day, and repair records often sit in a separate system from run-time data. Mileage, engine hours and idle time need to reach the same place as your work orders, or MTBR collapses to calendar guesswork. Combining telematics with maintenance records, as described in these fleet GPS data integration examples, gives you the usage denominator that makes a vehicle-level MTBR fair.
How a CMMS makes MTBR tracking routine
Spreadsheets can calculate MTBR once. They struggle to sustain it, because every repair must be coded the same way by every technician for years. A computerized maintenance management system builds the discipline into the workflow.
- Equipment history. Every work order attaches to an asset, so repair counts roll up by class without retyping. See how to track equipment history in MPulse.
- Required fields. Work order type and failure cause become mandatory, which keeps routine tasks out of the repair count.
- Preventive scheduling. Preventive maintenance automation generates routine tasks on schedule, separate from corrective repairs.
- Meter-based data. Runtime readings feed the operating-time side of the formula.
- Reports. Graphical reporting turns repair counts into trend lines your supervisor can review in a meeting.
If you are building the habit from scratch, getting more out of your CMMS covers the setup choices that determine data quality.
Our perspective on MTBR
We see the same pattern in the teams we work with. They start with a formula, discover that the number moves for reasons nobody can explain, and then realize the real project is data discipline. The metric is only as trustworthy as the work orders behind it.
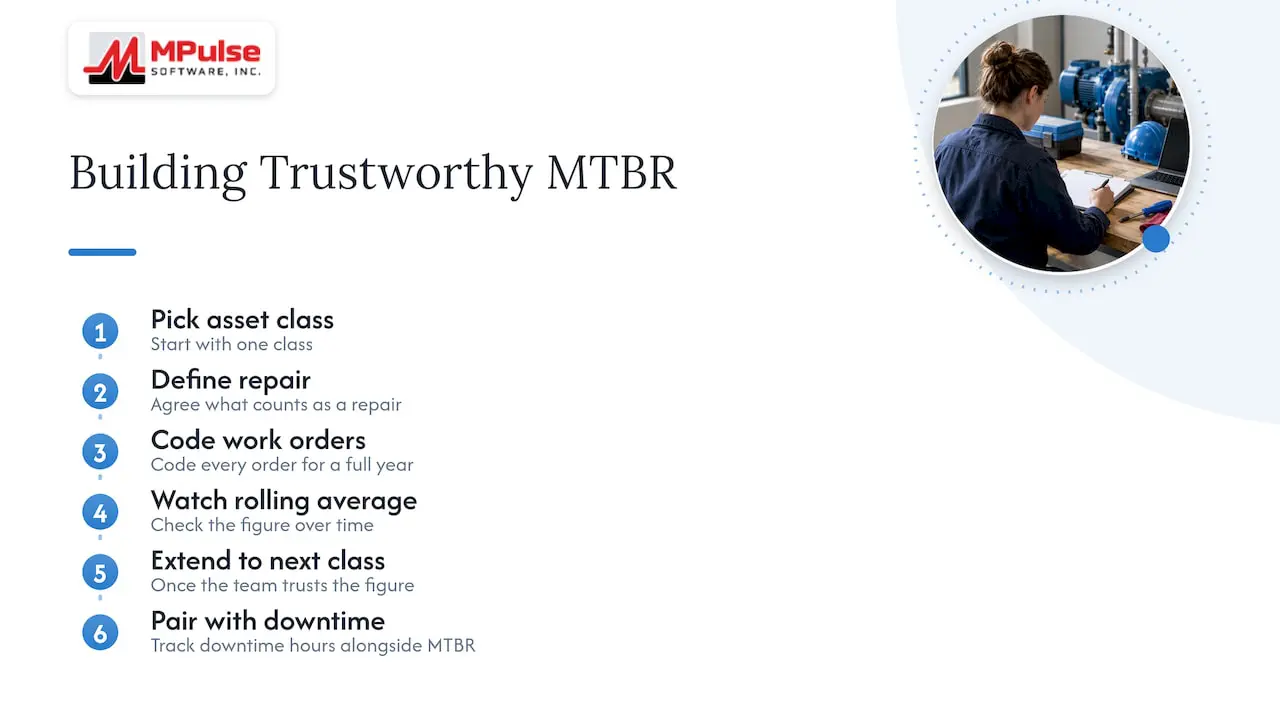
Our advice is to resist the urge to track ten metrics at once. Pick one asset class, define what counts as a repair, code every work order for a full year, and watch the rolling average. Once the team trusts the figure, extend it to the next class. Pair it with downtime hours so that a longer interval is never mistaken for a healthier asset when it really reflects deferred work.
For compliance-driven operations, such as healthcare facilities and regulated manufacturers, the same repair records double as audit evidence. Capturing them once, in the right structure, serves both purposes.
— Mark
Put MTBR tracking into practice with MPulse
MPulse CMMS ties repair work orders to asset histories, schedules preventive tasks on a calendar and reports the results graphically, so MTBR becomes a view of data you already collect. Plans are published on our pricing page: Professional is $29 per month per user and Advanced is $79 per month per user.

If you want help setting up asset classes, failure codes and reports, our implementation, training and consulting services cover that work.
FAQ
What does MTBR stand for?
MTBR stands for mean time between repairs, sometimes written mean time between repair. It is the average operating time between repair events on an asset or a population of assets. A higher value means repairs are needed less often.
Is MTBR the same as MTBF?
No. MTBF is built on failures, while MTBR is built on repair events. Planned work counts toward MTBR only when it requires restoration of the equipment, so routine inspections and lubrication stay out of the figure.
How long should the measurement period be?
Long enough to include a meaningful number of repairs. Because small populations and short periods cause big swings, a rolling average over six or twelve months is a common way to steady the trend.
Can I calculate MTBR without a CMMS?
Yes, with a clean list of assets, dated repair records and run-time data. The difficulty is consistency over time. A CMMS keeps repair coding and asset histories uniform, which is what makes the trend comparable year to year.
Sources
- Understanding Dirty Data: Comparing MTBR, MTBF, and MTBPM, Pumps & Systems
- Pump Pros Know: Reliability, Hydraulic Institute Pumps.org
- FedEx Freight Final Project Report, U.S. Department of Energy OSTI
- Best Practices for Reliability and Maintainability Estimates, OUSD(R&E), February 2025
- Towards predictive reliability: evaluating influential variables, IOP Publishing, 2026