
Maintenance data converts a facilities budget request from an anecdote into a verifiable cost, risk, and student-impact case that school boards can evaluate, approve, and defend to their communities. Districts that present quantified backlog costs, cost-per-square-foot benchmarks, and preventive-to-reactive ratios consistently outperform those that rely on narrative alone when competing for limited general fund dollars.
Key stat for your cover slide: A CCSD district review found that preventive maintenance programs, energy benchmarking, and centralized asset management projected multi-year General Fund savings — evidence that data-backed maintenance programs pay for themselves.
Boards respond most reliably to four categories of evidence:
- Backlog cost: Total dollar value of deferred repairs, calculated from open work orders and vendor quotes
- Cost-per-square-foot comparison: Your district’s maintenance spend versus peer districts or national benchmarks
- Preventive vs. reactive ratio: The share of planned work versus emergency repairs, which signals operational discipline
- Risk to instruction: Documented instances where facility failures disrupted learning time, attendance, or safety
Start by pulling these four numbers from your work-order history. If they are clean and sourced, you already have the core of a board-ready packet.
Pro Tip: Frame the opening sentence of your budget request around one of these four figures, not around a description of the problem. Boards process numbers faster than narratives.
Key Takeaways
Maintenance data strengthens school budget requests by converting deferred costs, asset risk, and facility-to-learning connections into quantified, board-ready evidence that boards can evaluate and approve.
| Point | Details |
|---|---|
| Lead with four core figures | Backlog cost, cost-per-square-foot, preventive-to-reactive ratio, and instructional downtime are the metrics boards respond to most reliably. |
| Clean data before you calculate | Non-random missing work-order data materially alters KPIs; run EDA, check missingness patterns, and document every correction before presenting. |
| Benchmark against peers | Comparing your cost per square foot or backlog to peer districts or APPA standards gives the board an external reference that validates your numbers. |
| Tie every ask to a learning outcome | Fewer than 23% of budget deliberations reference student progress; linking facility requests to attendance, safety, or instructional time moves them into the board’s primary decision frame. |
| MPulse Software automates the workflow | Standardized work-order fields, PM scheduling, and exportable dashboards make KPI production repeatable and audit-ready across every budget cycle. |
Table of Contents
- Why Maintenance Data Improves School Budget Requests — and Why Most Requests Fail Without It
- What benchmarks and backlog figures do school boards actually trust?
- What KPIs do school boards want to see in a budget packet?
- How do you make maintenance data defensible before presenting it?
- How do you turn cleaned maintenance data into a persuasive board package?
- How do you connect maintenance requests to student outcomes?
- A 90–180 day roadmap to prepare your next budget request
- How do you handle board objections with data-backed responses?
- What analytical checks make KPIs defensible to auditors?
- The case for leading with data, not with urgency
- MPulse Software makes this process repeatable, not just possible
- Sources
- FAQ
Why Maintenance Data Improves School Budget Requests — and Why Most Requests Fail Without It
Maintenance requests lose budget votes for a structural reason, not a political one. School boards are elected to prioritize learning outcomes, and when a facilities ask arrives without a clear connection to those outcomes, it competes poorly against curriculum, staffing, and technology line items that already speak the board’s language.
Brookings found that a minority of budget deliberations referenced student progress in the context of financial decisions. That gap is the core problem. Boards are not ignoring facilities out of indifference; they are approving what they can connect to their primary mandate.
Deferred maintenance compounds this framing problem. Each year a repair is postponed, the cost grows and the data trail thins. Without a work-order history, a facilities director cannot show the board how a $40,000 HVAC repair today prevents a $180,000 emergency replacement in three years. The request looks like a cost, not a cost-avoidance. Boards approve cost-avoidance.
One district that operated on reactive-only budgeting found itself replacing a chiller unit mid-school-year after repeated small repair requests were denied for three consecutive budget cycles. The emergency replacement cost exceeded the cumulative repair estimates by a wide margin, and the disruption closed two classrooms for six weeks. The data to prevent that outcome existed in the work-order system; it was never organized into a board-ready format.
Pro Tip: When presenting to a board, replace the phrase “deferred maintenance” with “unfunded liability.” The second phrase triggers the same financial instincts boards apply to pension obligations and bond debt.
What benchmarks and backlog figures do school boards actually trust?
Boards trust numbers they can verify against external references. A backlog figure drawn solely from internal estimates invites skepticism; the same figure benchmarked against a peer district or national standard becomes a credible data point.
Defining and calculating your backlog
The facilities management industry defines the deferred maintenance backlog as the total estimated cost to restore all assets to an acceptable condition. Calculate it by summing open corrective work orders, vendor quotes for identified deficiencies, and any capital renewal items documented in asset inspections. Assign each item a priority tier (safety-critical, code-required, operationally necessary, or discretionary) so the board can see where the risk concentrates.
Benchmarks boards expect to see
Public education spending data provides per-pupil and per-district figures that allow you to position your maintenance spend relative to comparable districts. Pair that with cost-per-square-foot figures from the Association of Physical Plant Administrators (APPA) or your state’s facilities benchmarking program. APPA’s Level 3 “Managed Care” standard is a widely cited reference point for K–12 facilities. Aging school infrastructure accelerates the gap between current spend and the APPA benchmark, which is exactly the argument a lifecycle cost table makes visible.
The preventive-to-reactive ratio is another figure boards recognize.
Minimum data table for a board packet
| Metric | Data Source | Calculation Method |
|---|---|---|
| Backlog cost | Open work orders + vendor quotes | Sum of estimated repair costs by priority tier |
| Cost per square foot | CMMS labor + materials ÷ total sq ft | Annual maintenance spend divided by gross square footage |
| Preventive vs. reactive ratio | Work-order type field | PM work orders ÷ total work orders × 100 |
| Asset age / remaining useful life | Asset registry | Current year minus install year; compare to manufacturer life expectancy |
| Peer district benchmark | State spending database or APPA | Your cost per sq ft vs. state or regional median |
A district review that recommended preventive maintenance and energy benchmarking projected recurring General Fund savings across multiple years once those programs were centralized and tracked. That kind of projection, grounded in real asset data, is what moves a board from “we’ll consider it” to a recorded vote.
What KPIs do school boards want to see in a budget packet?
Six core KPIs belong in every board-facing maintenance report. Present them in this order for a capital replacement request; for a smaller operating ask, lead with the preventive-to-reactive ratio and response time, then add backlog cost.
Detailed facility maintenance KPI definitions and calculation notes are available for each metric below.
1. Backlog cost
Definition: Total estimated cost to restore all assets to acceptable condition.
Data required: Open corrective work orders, vendor quotes, inspection reports.
Formula: Sum of estimated repair costs across all open items, sorted by priority.
Why boards care: It quantifies the unfunded liability sitting in the facilities portfolio.
2. Work order volume (annual)
Definition: Total work orders opened and closed in the fiscal year.
Data required: Work-order system export with open/close dates.
Formula: Count of work orders by type (PM, corrective, emergency) per year.
Why boards care: Volume trends reveal whether demand is growing and whether the team is keeping pace.
3. Preventive vs. reactive ratio
Definition: Share of planned maintenance work versus unplanned repairs.
Data required: Work-order type classification field.
Formula: PM work orders ÷ total work orders × 100.
Why boards care: A low PM ratio predicts higher future emergency costs.
4. Average response and repair time
Definition: Mean elapsed time from work-order creation to completion.
Data required: Work-order open and close timestamps.
Formula: Sum of (close date minus open date) ÷ total closed work orders.
Why boards care: Long repair times signal staffing or parts shortages that affect building availability.
5. Asset age and remaining useful life
Definition: Current age of major assets compared to expected service life.
Data required: Asset registry with install dates and manufacturer life expectancy.
Formula: (Current year minus install year) ÷ expected service life × 100 = % of life consumed.
6. Downtime and building availability
Definition: Hours or days a space was unavailable due to a maintenance failure.
Data required: Work orders flagged as “space unavailable” or linked to room-closure records.
Formula: Sum of downtime hours by building or system.
Why boards care: Downtime directly connects to instructional disruption.
Optional: Lifecycle cost or ROI — total cost of ownership for a major asset versus replacement cost, useful for capital requests over $100,000.
Prioritizing KPIs by ask size
- Small operating request (under $50,000): Lead with preventive-to-reactive ratio and average response time.
- Mid-range capital request ($50,000–$500,000): Add backlog cost and asset age.
- Large capital replacement (above $500,000): Present all six KPIs plus lifecycle cost and a multi-year cost-avoidance projection.
Pro Tip: Present KPIs as ranges with stated assumptions, not single-point estimates. A board member who asks “how confident are you in that number?” should hear “our estimate is $X to $Y, assuming these three conditions.” Ranges signal analytical honesty, not uncertainty.
How do you make maintenance data defensible before presenting it?
The credibility of your budget request depends entirely on the credibility of your underlying data. Work-order systems accumulate years of inconsistent entries: missing close dates, free-text descriptions that cannot be aggregated, technician codes that vary by shift, and assets tagged under three different naming conventions. Research from the PHM Society confirms that non-random missing data in maintenance work orders materially alters KPI calculations and can mislead decision-makers unless the missingness is analyzed and corrected before reporting.
Step-by-step data cleaning process
- Define your KPIs first. Know which six metrics you need before touching the data. This prevents scope creep and keeps the cleaning effort focused.
- Export and sample. Pull the last 24–36 months of work orders. Review a random sample of 100–200 records to identify the most common data-quality problems.
- Run an exploratory data analysis (EDA). Calculate missing-value rates for each field: close date, asset ID, work-order type, labor hours, and materials cost. A field with more than 15% missing values needs a correction strategy before you calculate any KPI that depends on it.
- Identify missingness patterns. Determine whether missing data is random or systematic. If emergency work orders are disproportionately missing close dates, your average repair-time KPI will be biased downward. A PHM Society best practices framework recommends applying natural language processing (NLP) to unstructured work-order text and implementing process changes to capture required fields going forward.
- Standardize tags and categories. Collapse variant spellings and codes into a single canonical list. “HVAC,” “H/VAC,” and “Heating/Cooling” are the same system; they should appear as one tag in every KPI calculation.
- Validate with spot checks. Cross-reference 10–20 high-cost work orders against vendor invoices and procurement records. Discrepancies above 10% indicate a systemic entry problem that needs a process fix, not just a one-time correction.
- Document every decision. Record which records were excluded, which fields were imputed, and why. This documentation becomes the assumptions appendix in your board packet.
Going forward: Require technicians to complete all mandatory fields before closing a work order. A CMMS with enforced required fields eliminates the most common source of missing data at the point of entry, which is far cheaper than cleaning historical records before every budget cycle.
How do you turn cleaned maintenance data into a persuasive board package?
A board packet that wins approval has five components: a one-page ask, a single dashboard slide, a prioritized project list with costs, a cost-avoidance or ROI example, and an assumptions appendix. Each piece serves a different audience in the room.
The one-page ask
Structure it in four sections: (1) the request amount and what it funds, (2) the top two or three KPIs that justify the ask, (3) the consequence of not funding it in dollar terms, and (4) the recommended approval motion. Keep it to one side of a single sheet. Board members read it before the meeting; it sets the frame for everything that follows.
The dashboard slide
One slide, three visuals maximum. Effective choices include:
- A bar chart of backlog cost by building, sorted highest to lowest
- A trend line showing the preventive-to-reactive ratio over 24–36 months
- A heat map of reactive work-order hotspots by building or system
Choose the visual that matches your ask. A capital replacement request calls for the backlog bar chart. An operating budget increase for preventive maintenance calls for the ratio trend line.
Cost-avoidance examples
Boards respond to avoided costs more than to repair costs. A short calculation works well: “Replacing this chiller now at $95,000 avoids an emergency replacement cost of $160,000 in an estimated 18 months, based on the asset’s current age and repair history.” Pair it with the asset-age KPI and a vendor quote. CMMS-driven operational savings follow a similar logic: shifting work from reactive to preventive reduces per-repair cost and eliminates the premium associated with emergency procurement.

Pro Tip: Attach a one-paragraph assumptions section to every cost-avoidance calculation. List the asset’s install date, the vendor quote date, and the failure-probability basis. A board member who questions the estimate should be able to trace every number back to a source document.
Talking points for the presentation
- Open with the single most compelling KPI: “Our deferred maintenance backlog is currently $X, which represents Y% of our total asset replacement value.”
- Transition to consequence: “At our current repair rate, we will reach a critical threshold on [specific system] within [timeframe].”
- Close with the ask: “Approving $X today avoids $Y in emergency costs and keeps [specific building or program] fully operational.”
Rehearse the three most likely objections before the meeting. Write a two-sentence response to each, grounded in a specific KPI or benchmark.
How do you connect maintenance requests to student outcomes?
GFOA’s best practices recommend rooting budget processes in instructional priorities and using multi-year planning tied to student outcomes. That guidance applies directly to facilities: a maintenance request that references a learning metric competes in the same category as a curriculum request, not against it.
The connection is not difficult to make. Facility conditions affect attendance, task performance, and safety, all of which boards track as performance indicators.
Practical use cases with board-ready language
- HVAC reliability and attendance: “Our three oldest HVAC units generated 47 emergency work orders last year and caused 12 early dismissals. Replacing them is projected to recover an estimated [X] instructional hours annually.”
- Lighting upgrades and task performance: Research consistently links adequate lighting to reading accuracy and sustained attention. A lighting upgrade request can reference the district’s literacy goals directly.
- Safety repairs and building access: Code-required safety fixes are not discretionary. Frame them as prerequisites for maintaining state accreditation and full enrollment, both of which have direct revenue implications for the district.
Facility managers who want to deepen this connection will find detailed examples in how facilities management supports student outcomes.
Pro Tip: Identify one small, high-visibility project — a restroom repair, a lighting fix in a frequently used corridor — and complete it before the budget meeting. Reference it as a proof point: “This is the kind of work the requested funding makes possible at scale.” Early wins build board confidence for larger capital asks.
A 90–180 day roadmap to prepare your next budget request
Phase 1: Weeks 1–4 — Scope and sample
- Identify the three to five KPIs your board will ask for, based on the ask size.
- Export 24–36 months of work-order data from your CMMS or spreadsheet system.
- Run a 100-record sample EDA to identify the most critical data-quality problems.
- Assign a data lead (facilities director or finance liaison) and set a weekly check-in.
Phase 2: Weeks 5–8 — Cleaning and KPI calculation
- Standardize asset tags, work-order type codes, and technician entries.
- Apply missingness corrections and document every decision.
- Calculate all six core KPIs and compare them against peer benchmarks.
- Validate high-cost records against vendor invoices.
Phase 3: Months 3–4 — Visuals and packet
- Build the dashboard slide and one-page ask.
- Draft cost-avoidance calculations for the top three projects.
- Write the assumptions appendix.
- Share a draft with the finance director for a pre-review.
Phase 4: Months 4–6 — Rehearsal and finalization
- Conduct a mock board presentation with the superintendent or a finance committee member.
- Rehearse responses to the top five objections.
- Finalize the packet, attach the assumptions appendix, and submit by the district’s budget deadline.
Milestone table
| Milestone | Deliverable | Owner | Target Week |
|---|---|---|---|
| Data export complete | 24–36 month work-order file | Facilities lead | Week 2 |
| EDA summary | Missing-value rates by field | Data lead / finance liaison | Week 4 |
| KPIs calculated | Six-KPI summary with ranges | Facilities lead | Week 8 |
| Benchmarks sourced | Peer comparison table | Finance liaison | Week 8 |
| Board packet draft | One-page ask + dashboard slide | Facilities lead | Month 3 |
| Finance pre-review | Signed-off assumptions appendix | Finance director | Month 4 |
| Mock presentation | Rehearsal notes and objection scripts | Facilities lead | Month 5 |
| Final submission | Complete board packet | Facilities lead | Month 6 |
Responsibility checklist
- Facilities lead: data export, KPI calculation, packet assembly, presentation
- Finance liaison: benchmark sourcing, cost-avoidance validation, budget calendar coordination
- Technicians: standardized work-order entry going forward, spot-check validation
- Procurement: vendor quote collection for backlog cost calculation
How do you handle board objections with data-backed responses?
Objections are predictable. Prepare for them the same way you prepared the data: systematically, before the meeting.
The five most common objections and scripted responses
-
“We don’t have the budget for this right now.”
Rebuttal: “The cost of not funding this is $[Y], based on our asset-age data and vendor quotes. Deferring this request increases the total cost by an estimated [Z]% per year.” -
“Instruction has to come first.”
Rebuttal: “This request directly supports instruction. Our HVAC failures caused [X] early dismissals last year, which affected attendance metrics the board tracks. Reliable facilities are a prerequisite for reliable instruction.” -
“How do we know your data is accurate?”
Rebuttal: “Our KPIs are calculated from [X] months of work-order records, validated against vendor invoices for the top 20 highest-cost items, and benchmarked against [peer district or state average]. The assumptions appendix documents every calculation.” -
“We addressed this last year.”
Rebuttal: “Last year’s repair addressed [specific item]. The current request covers [different system or building], which our asset-age analysis shows is now at [X]% of its useful life. The work-order history distinguishes the two.” -
“Can you provide more analysis before we vote?”
Response: “Absolutely. The assumptions appendix already includes the data sources and calculation methods. If the board wants a specific additional analysis, I can deliver it within [X] days. I’d recommend we set a date now so it can be incorporated before the next meeting.”
Quick QA pairs for rehearsal
- Q: “What happens if we defer this another year?” A: “Based on the asset’s current condition and our repair-cost trend, deferral adds an estimated [X]% to the total cost and increases the probability of an emergency failure.”
- Q: “How does our spending compare to similar districts?” A: “Our cost per square foot is [X], compared to a peer median of [Y], based on [state database or APPA benchmark].”
- Q: “What’s the return on this investment?” A: “The cost-avoidance calculation in the packet shows $[Y] in avoided emergency costs over [Z] years, against a request of $[X].”
When a board member asks for more analysis, do not appear defensive. Acknowledge the request, name the specific deliverable, and propose a timeline. This signals competence, not weakness.
What analytical checks make KPIs defensible to auditors?
KPI reliability depends on data quality, and data quality requires documented analytical checks. Two research-backed methods are most relevant for school facilities data.
Exploratory data analysis (EDA) checklist
- Calculate missing-value rates for every field used in a KPI calculation. Flag any field above 10% for a correction strategy.
- Check the distribution of repair durations. Extreme outliers (work orders open for 18+ months) often indicate data entry errors, not actual repair times; exclude or investigate them before calculating averages.
- Cross-check work-order counts against procurement records. A significant mismatch between work-order labor costs and purchase orders suggests either missing work orders or unrecorded vendor invoices.
- Segment missing data by work-order type, building, and technician. Non-random patterns (e.g., one building’s work orders consistently missing close dates) indicate a process problem, not random error.
Survival analysis for censored data
When work orders are still open at the time of analysis, their repair duration is unknown. Including them as zero or excluding them both bias the average repair-time KPI. PHM Society research recommends survival analysis techniques to account for these censored observations. In practice, this means using a Kaplan-Meier estimator or a simple imputation based on the distribution of closed work orders with similar characteristics.
Sensitivity example
Under a conservative assumption (those work orders had average durations), your mean repair time is 4.2 days. Under a pessimistic assumption (those work orders were the longest-running), the mean rises to 5.8 days. Presenting both figures to the board, with the stated assumptions, is more credible than presenting 4.2 days as a definitive answer.
Pro Tip: Include a one-paragraph methodology note in your assumptions appendix: “KPIs were calculated from [X] months of work-order data. Records with missing close dates ([Y]%) were handled using [method]. Outliers above [Z] days were excluded after investigation.” This is the language auditors and skeptical board members expect.
Stat callout: The PHM Society best practices framework recommends combining process changes, required-field enforcement, and NLP on unstructured text to systematically improve maintenance data quality and enable reliable asset performance analytics.
The case for leading with data, not with urgency
The conventional approach to a facilities budget request is to describe the problem vividly and hope the board feels the urgency. That approach fails more often than it succeeds, and the reason is structural: urgency is subjective, but a $2.4 million deferred maintenance backlog benchmarked against a peer district’s $800,000 is not.
What most facility managers underestimate is how much credibility they surrender by presenting a single-point estimate without stated assumptions. A board member with a finance background will immediately ask how the number was calculated. If the answer is “we estimated it,” the conversation shifts from the request to the methodology, and the request loses momentum. If the answer is “we calculated it from 36 months of work-order data, validated against vendor quotes, and compared it to the state median,” the conversation stays on the request.
The other underestimated factor is the multi-year framing. GFOA’s school budgeting best practices explicitly recommend multi-year forecasting tied to program outcomes. A facilities request that shows year-one cost, year-three cost-avoidance, and year-five asset replacement cost speaks the same language as a capital improvement plan. Boards that approve bond measures and capital plans are already comfortable with multi-year financial logic. Use it.
One practical note: the first time you present a data-backed facilities request, the board will likely ask more questions than usual. That is a good sign. It means they are engaging with the analysis rather than deferring the request. Prepare for a longer Q&A, not a shorter one, and treat every question as an opportunity to demonstrate that the data is solid.
MPulse Software makes this process repeatable, not just possible
Cleaning 36 months of work-order data manually before every budget cycle is not a sustainable workflow. The districts that consistently win maintenance funding have one thing in common: a CMMS that captures clean data at the point of entry, so the KPI calculation takes hours, not weeks.
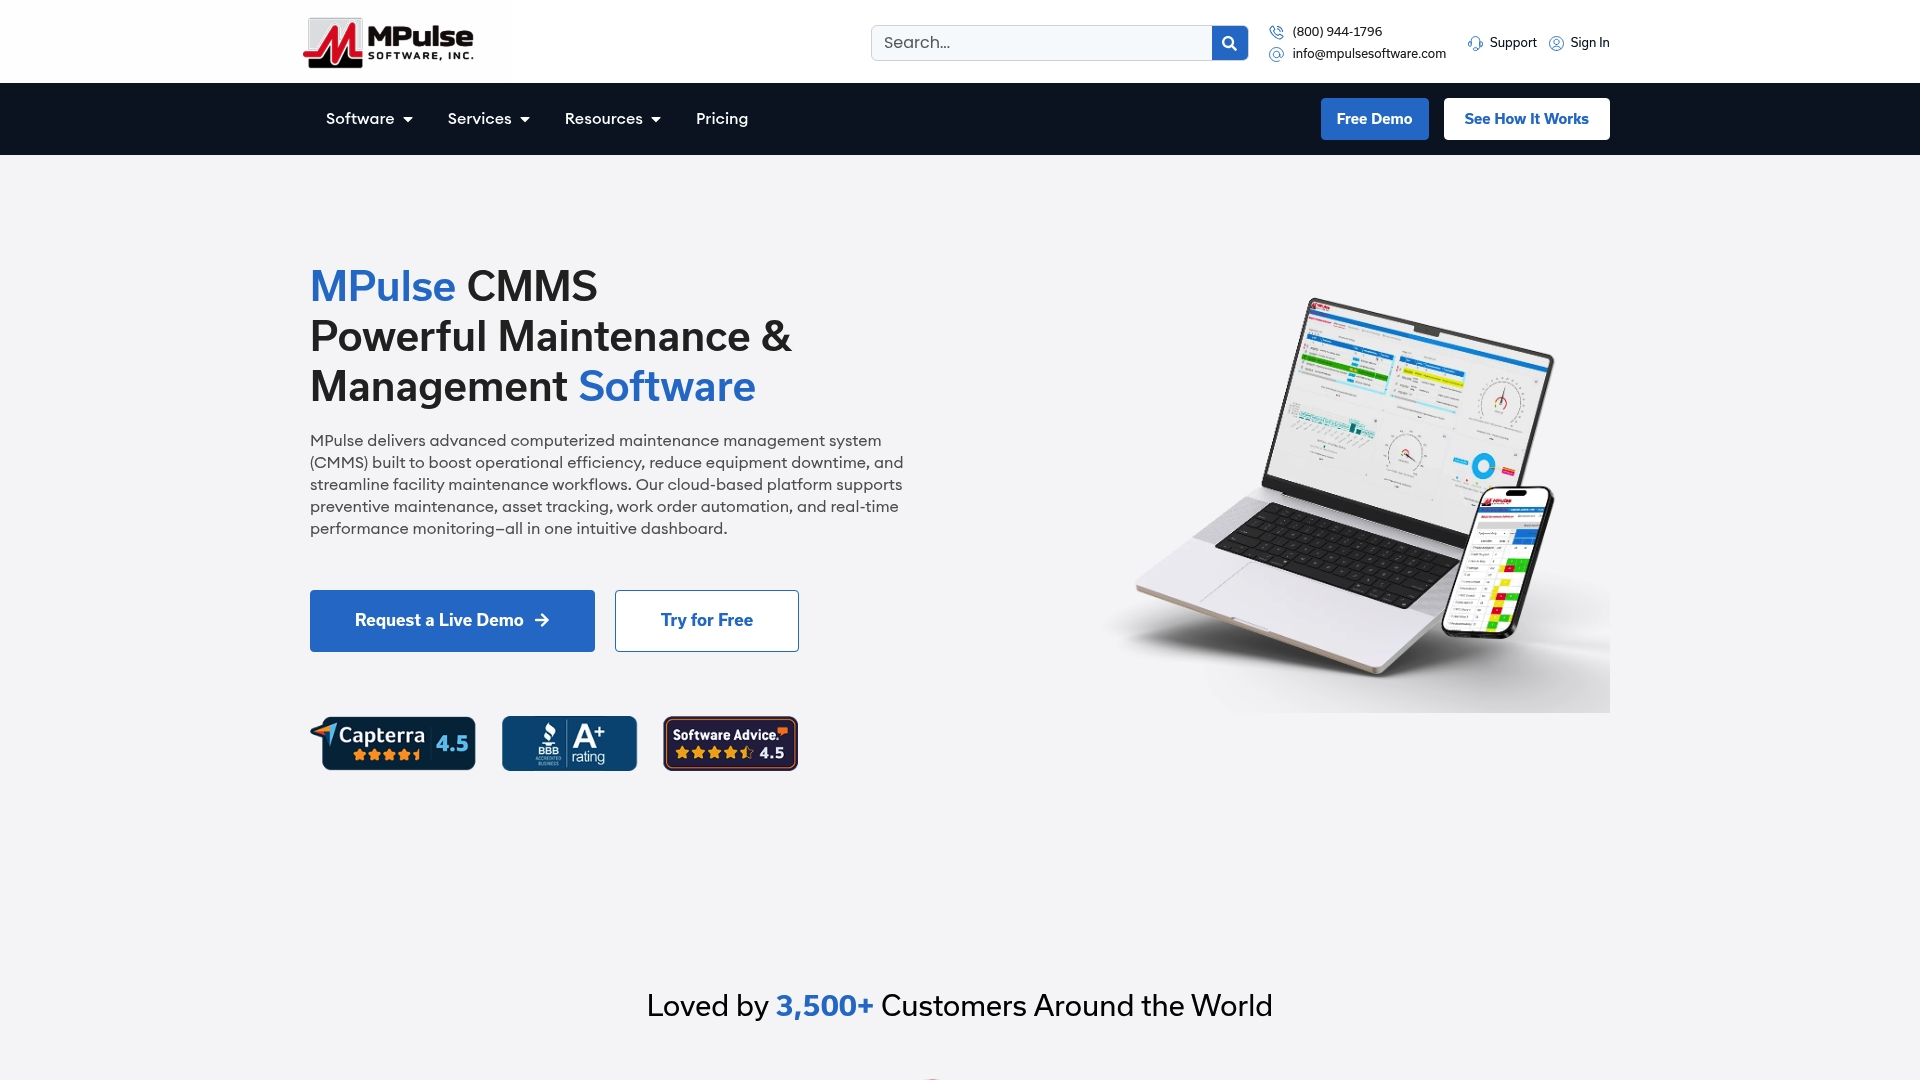
MPulse Software is built for exactly this workflow. Standardized work-order fields with enforced required entries eliminate the missing-data problems that bias KPIs. Preventive maintenance scheduling shifts your ratio toward planned work automatically, which means the board sees a trend line moving in the right direction before you say a word. Asset lifecycle costing and exportable dashboards turn the six-KPI summary into a report you can generate on demand, not a spreadsheet you rebuild from scratch each year.
The MPulse CMMS platform supports the full board-package workflow: work-order standardization, PM automation, asset registry, graphical reporting, and integration with procurement and ERP systems. When a board member asks for more analysis, you can deliver it in days, not months.
Before your next demo, ask the vendor to show you: (1) how required fields are enforced at work-order close, (2) how the system exports KPI data in a board-ready format, and (3) how asset lifecycle costs are tracked against replacement thresholds. Those three capabilities determine whether the CMMS supports defensible budget requests or just records work orders.
Schedule a demo to see how MPulse Software can help your district build a repeatable, audit-ready budget process before the next budget cycle opens.
Sources
The following sources are suitable for citation in your board packet’s appendix or footnotes:
- School boards should focus budget deliberations on student outcomes, financial sustainability | Brookings
- The Impact of Data Quality on Maintenance Work Order Analysis: A Case Study in HVAC Work Durations
- Best Practices in School Budgeting | GFOA
- 6.03.26 BWS 3.02© Report
- Educationdata
Linking directly to the methodology and assumptions sections of these sources, rather than just the homepage, signals analytical rigor to board members and auditors who follow up on citations.
FAQ
Why does maintenance data improve school budget requests?
Maintenance data converts anecdotal repair requests into quantified backlog costs, cost-per-square-foot benchmarks, and cost-avoidance projections that boards can evaluate against other budget priorities. Requests grounded in verified KPIs are harder to defer than narrative-only asks.
Why is a school maintenance budget important?
Deferred maintenance accumulates as an unfunded liability that grows each year repairs are postponed, often costing significantly more when systems fail under emergency conditions. A funded maintenance budget protects both the district’s physical assets and the instructional continuity those assets support.
What are school maintenance and other operating expenses?
School maintenance expenses include labor, materials, and contracted services for corrective and preventive repairs, plus capital renewal costs for major systems like HVAC, roofing, plumbing, and electrical. Operating expenses cover utilities, custodial services, and grounds, which are typically tracked separately from the maintenance backlog.
How can schools overcome budget constraints for facilities?
Districts that present data-backed requests, including peer benchmarks, cost-avoidance calculations, and multi-year forecasts tied to student outcomes, consistently outperform those relying on narrative alone. GFOA’s best practices recommend linking facility requests to the district’s instructional strategic plan to compete effectively for limited general fund dollars.
What should a school board expect to see in a maintenance budget request?
A complete request includes the six core KPIs (backlog cost, work-order volume, preventive-to-reactive ratio, average repair time, asset age, and downtime), a peer benchmark comparison, at least one cost-avoidance calculation, and an assumptions appendix that documents how every figure was calculated and validated.