
Mean time to repair (MTTR) is total repair time divided by the number of repairs over the same period. If five repairs took 10 hours in total, your MTTR is 2 hours. The formula is simple. The value of the number depends on what you decide to count as repair time and whether you apply that rule the same way every month.
This guide shows the formula, a worked example, the counting decisions that change your result, how to read benchmarks, and what moves MTTR down in practice.
TL;DR
- Formula: MTTR = total repair time ÷ number of repairs, both taken over the same period.
- Count only unplanned failures, and define the start and stop of the repair clock once, then keep it fixed.
- Benchmarks are context-dependent: a manufacturing target under 5 hours is a common reference, but severity, asset type and your own trend matter more.
- Look at the parts of the average: diagnosis and waiting for parts often take longer than the hands-on repair.
- Good records make the number trustworthy, which is where a CMMS work order history does the heavy lifting.
Table of Contents
- What MTTR measures
- The MTTR formula
- How to calculate MTTR step by step
- Decisions that change your MTTR
- MTTR next to MTBF and MTBR
- What is a good MTTR?
- How to reduce MTTR
- Perspective
- Put MTTR tracking to work in MPulse
- FAQ
- Sources
What MTTR measures
MTTR describes how long it takes, on average, to restore an asset to normal operating condition after it fails. The Society for Maintenance & Reliability Professionals (SMRP) frames it as a measure of maintainability, and its Best Practices, Metrics & Guidelines standardize how maintenance and reliability professionals define and calculate more than 70 indicators, each with a formula, component definitions and a sample calculation.
The abbreviation is used for several different clocks, and the difference matters when you write a service agreement or compare numbers with another site. Atlassian’s metrics guide separates three meanings:
- Mean time to repair: the time spent repairing and testing, ending when the system is fully functional again.
- Mean time to recovery: the full outage, from failure to full operation.
- Mean time to resolve: everything above, plus the time spent making sure the failure does not happen again.
A technical guide from SMEDA draws the same line for maintenance contracts: recovery includes notification, diagnosis and testing, while repair normally covers the work after the breakdown and excludes notification and diagnosis. For plant and facility teams, pick one definition and write it down before you start collecting data.
The MTTR formula
The standard calculation is:
MTTR = total repair time ÷ number of repairs
SMEDA’s guide states it as total downtime divided by the total number of breakdowns, and TechTarget describes it as total maintenance time divided by the number of repairs in a specific time frame. Its example: 120 minutes of repair time across 4 breakdowns gives roughly 30 minutes per repair.
Two conditions keep the formula honest, according to OEE Lab:
- Both measurements cover the same period.
- Repair time follows one consistent definition throughout.
The SMEDA guide also notes that MTTR leaves out planned shutdown work such as breaks, cleaning, inspection and lubrication. It represents how quickly you respond to and fix unplanned breakdowns. A preventive maintenance task that happens to take two hours does not belong in the calculation.
How to calculate MTTR step by step
The steps below follow the method OEE Lab lays out, with notes on where maintenance teams usually stumble.
- Define the repair window. Decide whether the clock includes detection, response, diagnosis, waiting for parts, hands-on repair, testing and return to service. Apply that definition to every event.
- Record each repair duration. Take the start and stop times from work orders, not from memory. Technicians should log them when the work happens.
- Add the durations. Sum every included repair in the period you are measuring, such as a month or a quarter.
- Count the repair events in that same period.
- Divide total hours by the number of events.
Worked example
Suppose a packaging line had five unplanned stops in a month. Using the example in the OEE Lab guide, the repair durations were:
| Repair | Duration (hours) |
|---|---|
| Failure 1 | 1.5 |
| Failure 2 | 3.0 |
| Failure 3 | 0.5 |
| Failure 4 | 4.0 |
| Failure 5 | 1.0 |
| Total | 10.0 |
Ten hours divided by five repairs gives an MTTR of 2 hours.
A second example from Atlassian uses minutes: ten outages with four hours (240 minutes) of active repair time gives 240 ÷ 10 = 24 minutes.
Keep the unit consistent
A team that logs some repairs in minutes and others in hours will produce a wrong average without any warning. Convert everything to one unit before summing. Hours work for most plant equipment, minutes for fast-cycling assets.
Decisions that change your MTTR
Two teams can repair the same machine in the same time and report different MTTR values. The cause is almost always one of these choices.
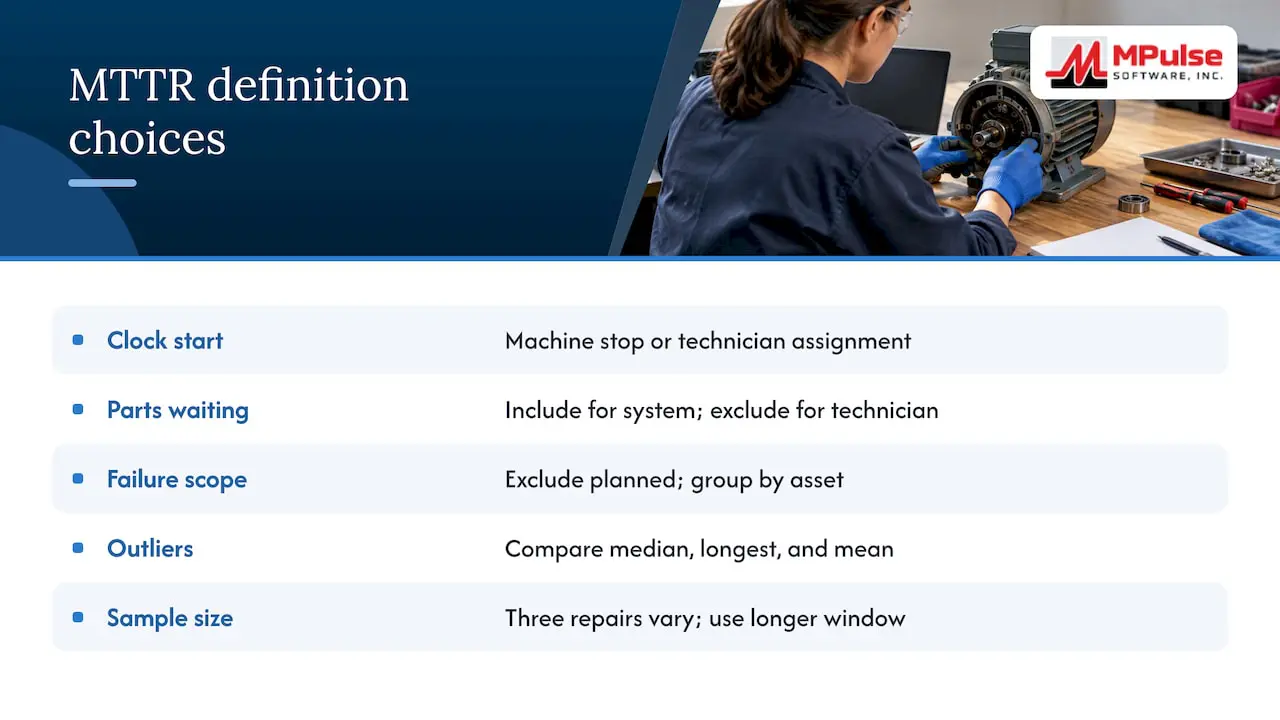
Where the clock starts. If it starts when the machine stops, you capture the time the operator took to notice and call it in. If it starts when a technician is assigned, you do not. Neither is wrong, but the numbers cannot be compared.
Whether parts waiting counts. Waiting for a part is downtime from the production point of view. If you exclude it, your MTTR describes technician performance. If you include it, it describes the whole maintenance system. Many teams track both.
Which failures are in scope. Keep planned work out. Group by asset class or criticality as well, because a single plant-wide average hides the difference between a conveyor motor and a boiler.
How you handle outliers. One three-day failure can dominate a month with ten short repairs. Look at the median and the longest events next to the mean before drawing conclusions.
Sample size. An MTTR built from three repairs moves wildly. Use a longer window for assets that rarely fail.
The average also hides where the time goes. OEE Lab’s example shows 6 of 10 hours lost to diagnosis and parts waiting, against only 2 hours of hands-on repair. In that case, better diagnostics and spare-parts availability would likely cut MTTR more than asking technicians to work faster.
MTTR next to MTBF and MTBR
MTTR tells you how fast you recover. It does not tell you how often you need to. Pair it with the failure-frequency metrics.
| Metric | What it answers | Typical use |
|---|---|---|
| MTTR | How long does an average repair take? | Maintainability, response and repair process |
| MTBF | How long does an asset run between failures? | Reliability of repairable equipment |
| MTBR | How long between repairs of any kind? | Includes planned and unplanned repair events |
Pumps.org explains that MTBF measures the average operating time between breakdowns, while MTBR counts downtime for failures, planned maintenance or any other repair event. For more on each, see our guides to mean time between failures and tracking mean time between repairs.
The three connect through availability. A LibreTexts chapter gives availability as (MTBF − MTTR) ÷ MTBF, and notes that downtime is proportional to MTTR ÷ MTBF. In other words, cutting repair time and stretching the time between failures are equally valuable ways to reduce downtime.
What is a good MTTR?
There is no universal answer, but there are useful reference points.
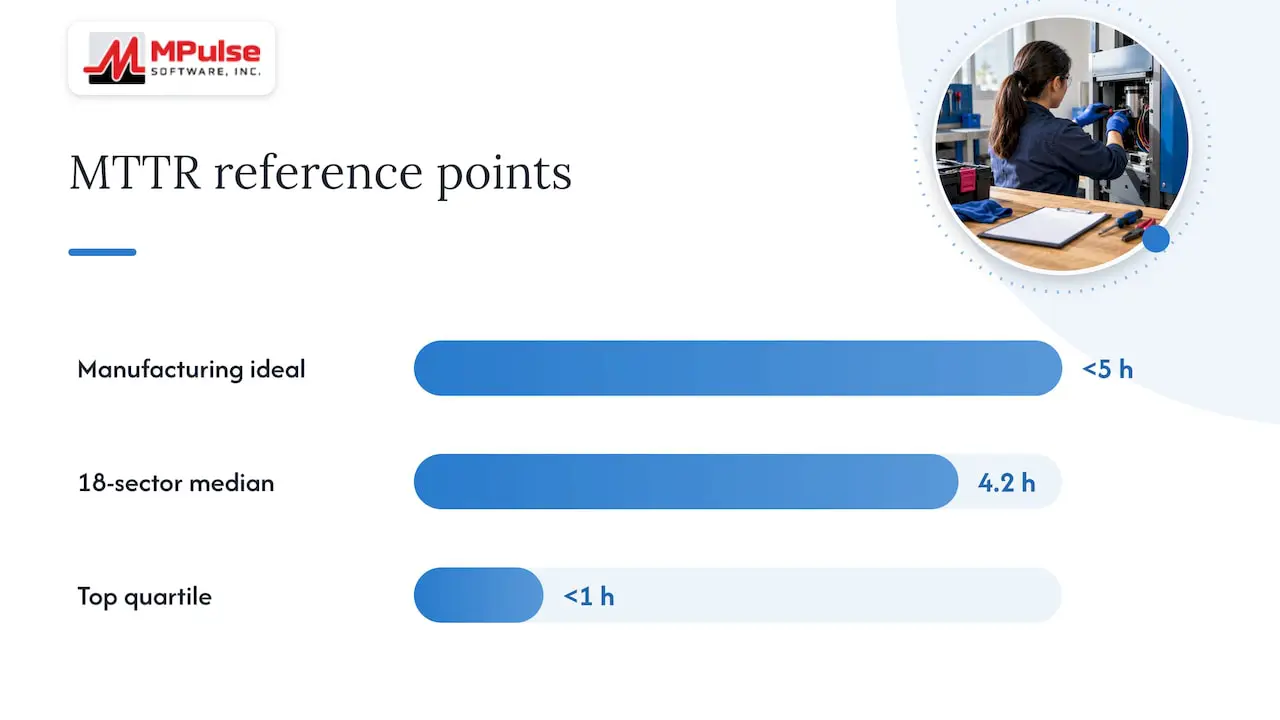
- Atlassian’s guide says that for manufacturing systems an MTTR under 5 hours is ideal, while IT and security teams aim for near zero.
- Manufacturing-Metrics.org reports a global median MTTR of 4.2 hours across 18 sectors, with the top quartile under 1 hour.
Use these as a sanity check, not a verdict. A 4-hour MTTR on a critical line with a spare-part strategy is a different problem from 4 hours on a noncritical pump. Severity also matters: a minor jam and a gearbox failure should not share one target.
The most useful benchmark is your own history. Set a baseline by asset class, review it monthly, and watch the trend. Our piece on why you should set maintenance benchmarks covers how to choose them. If you are building a wider scorecard around MTTR, the principles of KPI-driven management apply: fewer indicators, clear definitions and a regular review rhythm beat a long dashboard nobody reads.
How to reduce MTTR
Once you can see where repair time goes, the levers become clear.
Shorten diagnosis. Keep asset histories, failure codes and manuals attached to each asset so a technician arriving at a breakdown can see previous failures and the fixes that worked.
Fix parts availability. If waiting on parts is a big share of your repair time, review minimum stock levels for critical spares and link parts to the assets that use them.
Dispatch faster. Clear priority rules, mobile work orders and visibility of technician workload reduce the gap between a failure report and someone arriving.
Standardize the repair. Written procedures and checklists for recurring failures make a good repair repeatable and help newer technicians work at the pace of experienced ones.
Prevent the failures that cause long repairs. The U.S. National Institute of Standards and Technology (NIST) found that manufacturing establishments investing more heavily in preventive or predictive maintenance had, on average, 44% less downtime. The Pacific Northwest National Laboratory describes reliability-centered maintenance as a blend of reactive, preventive and predictive approaches with root-cause analysis, and says predictive maintenance allows preemptive corrective action and less downtime. Our overview of how preventive maintenance reduces downtime shows how to put this into a schedule.
Review the worst repairs. Each month, pick the three longest events and ask what delayed them. The causes are usually repeatable: a missing part, an unclear procedure, a late call.
Perspective
We see the same pattern with teams that start tracking MTTR. The formula takes a minute to learn. The hard part is trusting the inputs.
If start and stop times live on paper or in people’s heads, the number is an estimate and the debate turns into an argument about the data. When every breakdown is a work order with timestamps, labor, parts and failure cause attached to the asset, MTTR becomes something you can break apart and act on.
That is how we designed MPulse. Preventive maintenance automation reduces the surprise failures that produce the longest repairs. A calendar interface shows what is scheduled and who is available. Asset records, parts inventory and reporting sit in one system, so the question “where did the time go?” has an answer. Our customers report efficiency improvements of up to 40%, and we build for that outcome: fewer unplanned stops and shorter ones when they happen.
Start with one definition of repair time, one asset group and one quarter of clean data. Improve from that baseline.
Mark
Put MTTR tracking to work in MPulse
If you calculate MTTR from spreadsheets today, a CMMS removes the manual collection. MPulse records work orders, asset history and parts usage in one place, so repair durations are already there when you need the average. Plans start at $29 per user per month for Professional and $79 per user per month for Advanced, and you can compare editions on our pricing page.

If you want help getting your data model right from the start, our implementation and training services cover setup, hosting and onboarding for your team. To see which KPIs to put beside MTTR, read how to measure maintenance performance KPIs with software or our guide to maintenance KPIs.
FAQ
What is the formula for MTTR?
MTTR equals total repair time divided by the number of repairs in the same period. For example, 10 hours of repair across 5 failures gives 2 hours. Use one consistent definition of repair time for every event.
What is considered a good MTTR?
For manufacturing systems, an MTTR under 5 hours is often cited as ideal, and one published median across 18 sectors is 4.2 hours. Your best target depends on asset criticality and failure severity, so compare against your own baseline by asset group first.
What is the difference between MTTR and MTBF?
MTTR measures how long a repair takes on average. MTBF measures how long an asset runs between failures. Availability depends on both, so improving either one reduces downtime.
Should planned maintenance be included in MTTR?
No. MTTR is meant for unplanned breakdowns. Planned work such as inspection, cleaning and lubrication is excluded, because including it would distort the average and hide the real speed of your breakdown response.
Sources
- Technical Guide on Mean Time To Repair, SMEDA
- Common Incident Management Metrics, Atlassian
- MTTR (mean time to repair), TechTarget
- How to Calculate MTTR: Formula & Example, OEE Lab
- Best Practices, Metrics & Guidelines, SMRP
- Manufacturing Metrics & KPIs, Manufacturing-Metrics.org
- Pump Pros Know Reliability, Pumps.org
- Measures of Reliability and Failure Tolerance, LibreTexts
- Economics of Manufacturing Machinery Maintenance, NIST
- Reliability Centered Maintenance, Pacific Northwest National Laboratory
- Pilotage par KPI