

To calculate CMMS ROI, subtract the total cost of the system from the savings it produces, divide by that cost, and measure both over the same period. The formula is the easy part. The result is only as credible as the baseline you measure before go-live and the discipline you use to count savings afterward. A maintenance management team that records downtime, overtime, parts spend and planned-versus-reactive work before it starts can show finance a defensible number. A team that estimates after the fact usually cannot.
This guide gives you the formula, the cost and savings categories to include, a worked example with payback, and a routine for tracking results once the system is live. If you want to run your own figures as you read, our CMMS ROI calculator takes the same inputs.
TL;DR
- CMMS ROI = (savings − total cost) ÷ total cost, measured over a fixed period, usually the first 12 months and then each year after.
- Count the full cost: subscription or license, implementation, training, hosting or support, integrations and your own staff’s time to load data.
- Count only savings you can trace to a baseline: less unplanned downtime, lower overtime, fewer emergency parts orders, better labor use and longer asset life.
- Payback period = total up-front cost ÷ monthly net savings. Track it quarterly against the baseline you recorded before go-live.
- Savings only appear when the system is used consistently, so plan adoption as part of the investment.
Table of Contents
- The CMMS ROI formula
- What to include on the cost side
- What to include on the savings side
- Record your baseline before go-live
- A worked example
- A real-world payback benchmark
- Make the savings happen: adoption is part of the investment
- Track results after implementation
- Where MPulse fits in your ROI case
- Our perspective
- FAQ
- Sources
The CMMS ROI formula
A computerized maintenance management system (CMMS) is software that schedules preventive maintenance, manages work orders, tracks assets and parts, and records the history of every repair. Its return comes from what that record and automation change in your operation.
The standard formula:
ROI (%) = (Total savings − Total cost) ÷ Total cost × 100
Two companion measures make the result easier to explain to a budget committee:
- Payback period (months) = total up-front cost ÷ average monthly net savings. This tells finance when the investment is recovered.
- Net benefit = total savings − total cost. This gives the dollar amount that remains after the system has paid for itself.
Choose the measurement period before you start. Most teams use 12 months for the first-year ROI, then a three-year view because implementation and training costs fall mostly in year one while savings continue. Showing both years one and three avoids a common mistake: judging the system on a first year that carries all of the setup cost and only part of the benefit.
What to include on the cost side
Understating cost is the fastest way to lose credibility with finance. Include every category below, even the ones that never appear on a vendor invoice.
- Software subscription or license. For a subscription, multiply the per-user price by the number of users and by 12 months. MPulse lists its Professional plan at $29 per month per user and its Advanced plan at $79 per month per user on the pricing page. Technician licenses and enterprise add-ons are quoted separately.
- Implementation. Configuring asset lists, locations, preventive maintenance schedules and workflows. CMMS implementation services are one way to bring this cost and the timeline under control.
- Training. Everyone who creates, assigns or closes work orders needs to know how to do it the same way.
- Hosting and support. Cloud hosting fees, or the server and IT time for an on-premise installation, plus an annual support program if you use one.
- Integrations. Connecting the CMMS to an ERP, single sign-on or building sensors takes setup effort and sometimes an add-on.
- Internal labor. Hours your team spends cleaning asset data, building the parts catalog and attending training. Multiply those hours by a loaded hourly rate and put the number in the cost column.
The free-requester model matters here too. When the people who report problems, such as teachers, nurses or tenants, do not need paid seats, the user count that drives your subscription is just the people who manage and perform the work. MPulse offers unlimited free requesters, so your cost is driven by the technicians and supervisors who work in the system.
What to include on the savings side
Savings fall into two kinds, and keeping them apart is what makes the calculation hold up.
Realized savings appear in your accounts: lower overtime, fewer rush freight charges, fewer outside contractor call-outs, a smaller emergency parts spend.
Avoided costs and productivity gains are real but do not reduce a line item directly: a breakdown that did not happen, or technician hours that moved from chasing paperwork to completing work. Count them, but label them, and show finance the realized total separately so the conservative number stands on its own.
Less unplanned downtime
This is usually the largest category. Multiply the hours of unplanned stoppage you had in the baseline year by what an hour costs: lost production or revenue, idle labor, and restart costs. Then apply the reduction you can reasonably attribute to better preventive maintenance. For a hospital or school, the cost of an hour may be harder to price, so use the repair, overtime and relocation costs you can document.
Better use of technician time
A CMMS removes searching for history, rewriting paper work orders and walking to look up a part. Measure how many work orders a technician closes per week and the share of labor hours spent on planned versus reactive work, before and after. Convert recovered hours into dollars with the loaded labor rate, and mark this as a productivity gain unless it cuts overtime or contractor spend.
Lower parts and inventory cost
When the system tracks parts, minimum stock levels and usage per asset, you buy fewer emergency orders and carry less idle stock. Baseline the past year’s expedited shipping, duplicate purchases and write-offs.
Longer asset life
Postponing a replacement is a legitimate saving, but it is the hardest to prove. Use it as a three-year item, built from the service history in the system, and keep it out of the first-year conservative case.
Compliance and audit time
For healthcare, education and regulated manufacturing, hours spent assembling inspection records before an audit are a measurable cost. If your records are produced from the system instead of reassembled by hand, count the hours saved. For more ways teams find these categories, see seven ways a CMMS can save you money and what a CMMS saves small companies.
Record your baseline before go-live
Every savings figure is a comparison, so you need the “before” number. Gather these for the previous 12 months:
- Hours of unplanned downtime per critical asset or area, and the cost per hour.
- Overtime hours and dollars in maintenance.
- Emergency parts and rush freight spend, and outside contractor spend.
- Percentage of work orders that were planned versus reactive.
- Number of preventive maintenance tasks scheduled, and the share completed on time.
- Hours spent preparing for audits or inspections.
If your records are incomplete, use the best estimate you can document and say so. A transparent estimate beats a precise-looking figure with no source. Our guide on how to identify the benefits of a CMMS and calculate the costs of a CMMS walks through the same inputs.
A worked example
The numbers below are illustrative assumptions for a mid-sized facility, not a customer result. Replace each one with your own baseline.
The facility: 10 CMMS users (supervisors and technicians), on the Professional plan.
Year-one cost
| Item | Assumption | Amount |
|---|---|---|
| Subscription | 10 users × $29 × 12 months | $3,480 |
| Implementation and training | Assumed one-time budget | $6,000 |
| Internal data-loading time | 80 hours × $45 loaded rate | $3,600 |
| Total year-one cost | $13,080 |
Annual savings against the baseline
| Category | Baseline | Assumed reduction | Savings |
|---|---|---|---|
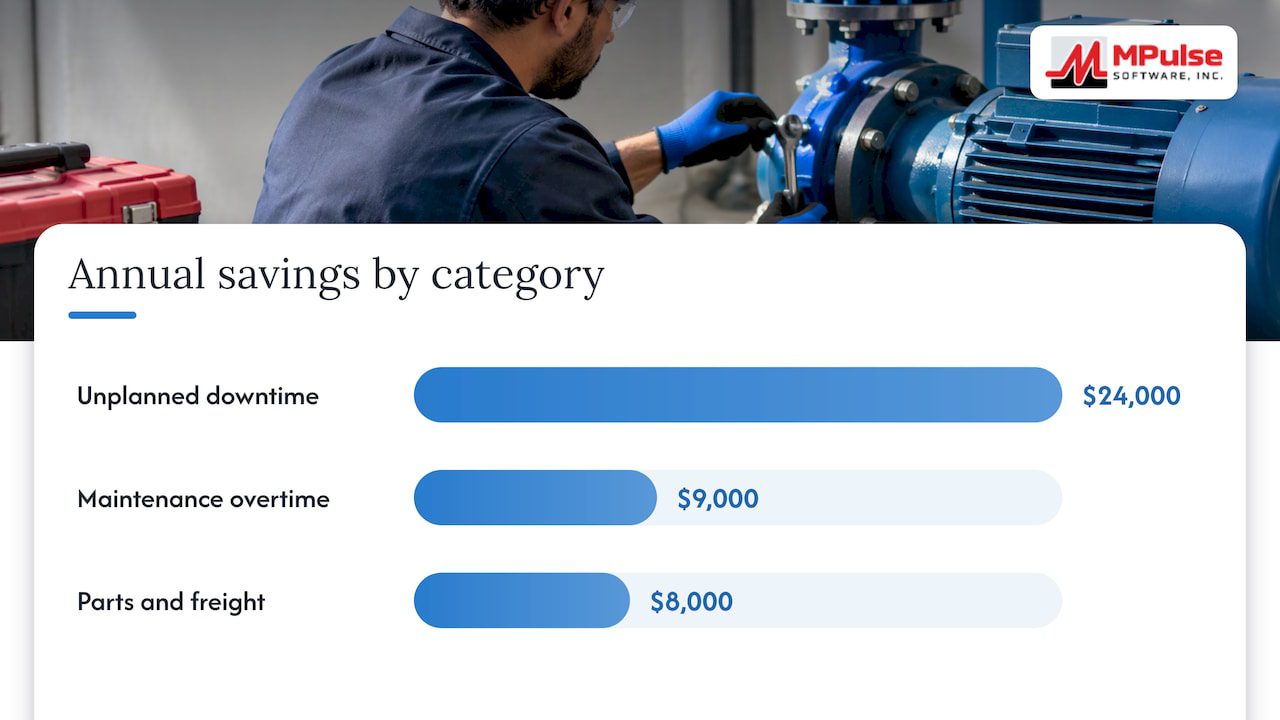
| Unplanned downtime | 120 hours × $2,000 = $240,000 | 10% | $24,000 |
| Maintenance overtime | $60,000 | 15% | $9,000 |
| Emergency parts and freight | $40,000 | 20% | $8,000 |
| Total annual savings | $41,000 |
The result
- Year-one ROI = ($41,000 − $13,080) ÷ $13,080 = 2.13, or about 213%.
- Payback = $13,080 ÷ ($41,000 ÷ 12) = about 3.8 months.
- Year-two ROI, when only the $3,480 subscription remains = ($41,000 − $3,480) ÷ $3,480, or about 1,078%.
Two cautions make this example more useful than the headline. First, savings rarely arrive on day one: schedules need to be built and technicians need to adopt the workflow, so a realistic model phases savings in over the first two or three quarters. Second, finance will ask which of the $41,000 is realized. Here the overtime and parts lines ($17,000) are visible in the accounts, while the downtime line is partly avoided cost. Present both totals.
A real-world payback benchmark
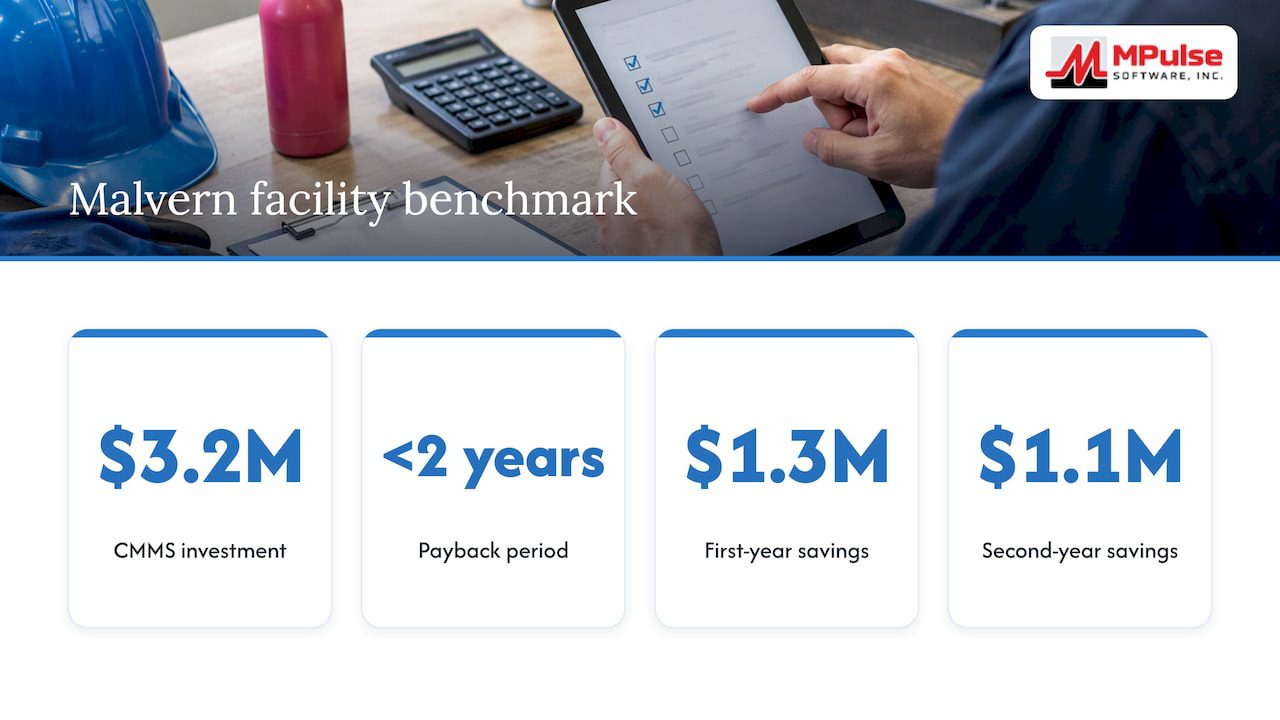
Published case studies show how this looks at larger scale. ABB reports that a pharmaceutical manufacturing facility in Malvern, Pennsylvania paid back its $3.2 million CMMS investment in under two years, with savings of $1.3 million in the first year and $1.1 million in the second, plus a 30% productivity increase. A project of that size carries far more cost than a typical facility team will, but the pattern is the same: the largest costs come first, and savings repeat every year.
Our own customers, more than 3,500 of them worldwide, have reported efficiency improvements of up to 40%. Treat that as an upper-end reference, and build your business case from your own baseline.
Make the savings happen: adoption is part of the investment
A CMMS does not make maintenance decisions. The US Department of Energy’s Operations and Maintenance Best Practices Guide describes its core value as collecting and storing information in retrievable form, so the manager has the best data to drive efficiency. The same guide points out that a successful installation needs a champion who keeps the system in use, because a lack of commitment to persist is a common reason installations fall short.
That is why adoption belongs in the ROI model. Budget for it:
- Name one owner for the system who reviews overdue preventive maintenance and open work orders weekly.
- Train every user on the same close-out routine so history stays complete.
- Use mobile access and barcode scanning, so technicians record work where it happens instead of at the end of the shift.
- Set the preventive maintenance calendar first, then add condition-based triggers from sensors once the basics are stable.
The maintenance calendar view in MPulse is designed so supervisors can see planned work and shift it quickly, which supports the schedule discipline that produces the downtime savings in your model.
Track results after implementation
The business case is a forecast. Turn it into a report by reviewing the same measures you baselined, on a fixed schedule.
- Monthly: planned versus reactive work orders, preventive maintenance completion rate, overtime hours, emergency parts spend.
- Quarterly: downtime hours on critical assets, cost per hour, backlog age, and the running payback calculation.
- Annually: recalculate ROI with the actual subscription, support and training cost, and add asset-life and compliance-hour savings once you have a full year of history.
Keep a short note beside each number saying how it was measured, and do not change the method between periods. When a reduction cannot be traced to a work order record, leave it in the “avoided” column.
Where MPulse fits in your ROI case
The plans, services and add-ons you choose change the cost side of the formula, and the features you use change the savings side. MPulse offers preventive maintenance automation, work order management, asset tracking, inventory management for parts, barcode scanning, mobile access, graphical reporting and ERP and sensor integration. The Professional plan is $29 per month per user and the Advanced plan is $79 per month per user, with unlimited free requesters. If your operation needs implementation help, training, hosting or a support program, see the services page and the Maintenance & Support Program, and compare editions on the pricing page.
You can enter your own downtime, labor and parts figures in the MPulse CMMS ROI calculator to see a first estimate of savings and payback before you speak to anyone.
Our perspective
We built MPulse around a simple idea: maintenance teams should be able to show what they save. A CMMS earns its place when the work it organizes becomes visible in numbers a finance director accepts.
In our experience, the strongest ROI cases share three habits. They record a baseline before go-live. They count the full cost, including implementation, training and the time the team spends loading data. And they track results monthly instead of waiting for an annual review.
That is why we pair the software with services. Implementation, training, hosting and the Maintenance & Support Program exist so that the system is configured correctly and used consistently, which is where the savings come from. For regulated sites such as healthcare, education and manufacturing, the same records support audit readiness, so compliance time belongs in the calculation too.
Start with your own numbers. Even a rough baseline, honestly documented, will tell you where a CMMS can return the most.
Mark
FAQ
What is a good ROI for a CMMS?
There is no universal benchmark, because the result depends on your downtime cost, labor rates and how much of your work is still reactive. A sound target is a payback period within the first year, with ROI growing in later years as setup costs drop away. Judge it against your own baseline rather than another company’s headline figure.
How long does it take to see a return?
Most of the cost comes in the first months, and savings build as preventive schedules take effect and users adopt the workflow. Model the savings phased in over two to three quarters, then review payback each quarter against your recorded baseline.
Which costs do people most often forget?
Internal labor for data loading and training, integration work, and hosting or support fees. Add them to the cost column so the ROI figure is not overstated when finance reviews it.
How do I separate realized savings from avoided costs?
Realized savings show up as lower spend in your accounts, such as overtime, rush freight and contractor invoices. Avoided costs, such as a failure that did not occur, and productivity gains from recovered technician hours are real but estimated. Report the two totals separately and let the realized number stand as your conservative case.
Sources
- Operations & Maintenance Best Practices Guide: Release 3.0, US Department of Energy
- ABB case study: computerized maintenance management at a Johnson & Johnson Centocor facility