

To calculate MTBF (mean time between failures), divide the total operating time of an asset by the number of failures in the same period. If a pump ran 2,142 hours and failed 3 times, its MTBF is 714 hours. The formula is simple. The hard part is deciding what counts as operating time and what counts as a failure, because those two choices decide whether the number means anything.
This guide covers the formula, the inputs, five worked examples, how MTBF relates to MTTR and MTTF, the data mistakes that make it misleading, and how maintenance teams turn the number into schedules and decisions.
TL;DR
- MTBF = total operating time ÷ number of failures, for repairable assets, over a defined measurement period.
- Use actual running hours, not calendar hours, and subtract downtime. Use one consistent definition of “failure.”
- MTBF is not a service life or a guarantee. It describes the average during an asset’s stable useful life.
- Track it per asset or per fault code, and read it next to MTTR to see the full availability picture.
- A CMMS that records runtime and failure work orders in a standard way produces the inputs automatically.
Table of Contents
- The MTBF formula
- What counts as operating time
- What counts as a failure
- How to calculate MTBF step by step
- MTBF examples, worked through
- Reading the result correctly
- MTBF, MTTR and MTTF compared
- Common mistakes that distort MTBF
- Where MTBF is used
- Getting clean MTBF inputs
- Our perspective
- Put MTBF to work in MPulse
- A short checklist before you publish an MTBF number
- FAQ
- Sources
The MTBF formula
The standard formula is:
MTBF = Total operating time ÷ Number of failures
The SECNAV reliability and maintainability guidebook defines MTBF as a basic measure of reliability for repairable items: the average time during which all parts of the item perform within their specified limits, over a particular measurement period under stated conditions. Two phrases matter there: “repairable” and “stated conditions.” MTBF only makes sense for equipment you fix and return to service, and only when you say how and over what period you measured.
Under the common assumption of a constant failure rate, MTBF is the reciprocal of the failure rate (λ). In other words, λ = number of failures ÷ total operating time, and MTBF = 1 ÷ λ, as IEEE’s overview of the metric explains for the exponential case.
What counts as operating time
Operating time is the time the asset was actually running during the measurement period. It is not calendar time and not scheduled time. Reliable Media’s methodology guide explains that downtime is excluded because an asset that is stopped is not exposed to failure.
That gives you a practical rule:
- Start with the hours the asset was scheduled to run.
- Subtract all downtime, including repair time, waiting for parts and delays.
- The remainder is your operating time.
If your plant runs one shift on a line, the other 16 hours a day are not operating time. If you divide a full calendar quarter by the failures, you will overstate MTBF, sometimes by a lot (see the example below).
What counts as a failure
The same guide warns that the definition of a failure matters significantly. Some teams count any unplanned stoppage that needs intervention. Others count only stoppages longer than a threshold, such as 5 to 15 minutes. Neither is wrong, but changing the definition midstream makes your trend meaningless.
A workable definition for most maintenance teams has three parts:
- The stop was unplanned. Scheduled preventive maintenance, changeovers and planned shutdowns are not failures.
- The asset could not perform its intended function at specification.
- The event required corrective action and was recorded on a work order.
Write the definition down, apply it to every asset, and keep it fixed for at least a full reporting year.
How to calculate MTBF step by step
- Pick the asset and the period. A single asset or a group of identical assets, over a quarter or a year. Short periods with few failures give unstable numbers.
- Add up scheduled run time for the period.
- Subtract downtime for every stop in the period, including delays.
- Count unplanned failures using your written definition.
- Divide operating time by failures.
- Record the context: period, asset, definition and operating conditions, so the number can be compared later.
If there were zero failures, the formula cannot produce a number. Report “no failures in X operating hours” and extend the period until you have data.
MTBF examples, worked through
Example 1: continuous operation
The b_TEC training material hosted by OSTI, the U.S. Department of Energy’s research repository, calculates MTBF for equipment that runs 24 hours a day, 7 days a week for 2 weeks. That is 336 hours. With 3 failures that were repaired immediately, MTBF = 336 ÷ 3 = 112 hours per failure.
Example 2: scheduled hours minus downtime
A pump is scheduled for 2,160 hours in a quarter. Downtime, including all delays, totals 18 hours, and there were 3 failures. Reliable Media’s worked example gives MTBF = (2,160 − 18) ÷ 3 = 714 hours.
Example 3: the calendar-time mistake
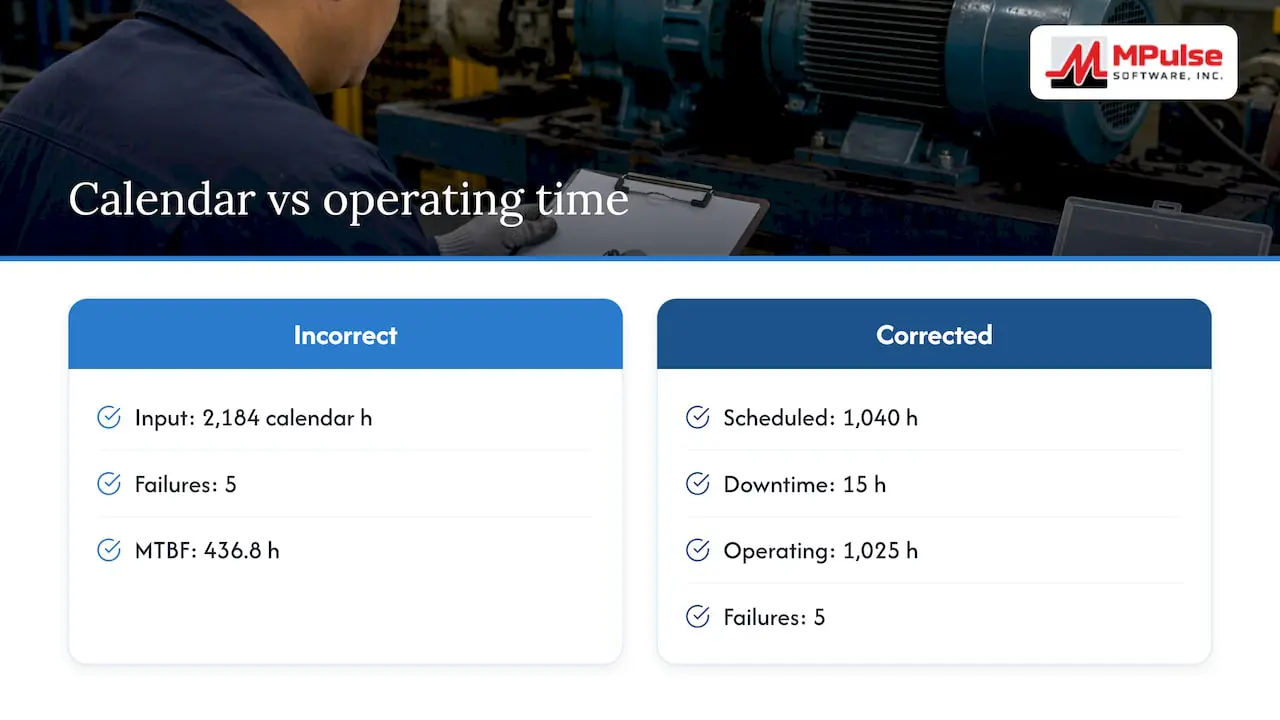
The same guide shows how the wrong input distorts the answer. Dividing 2,184 calendar hours in a quarter by 5 failures gives 436.8 hours. But the asset was scheduled for only 1,040 hours, with 15 hours of repair downtime. The correct figure is 1,025 ÷ 5 = 205 hours. Using calendar time more than doubled the apparent reliability.
Example 4: a population of units
For a fleet of identical units, you pool the hours. Seagate’s reliability guidance illustrates this with 1,000 drives running 1,000 hours each, which is 1,000,000 device-hours. With 5 failures, MTBF is 200,000 hours. Note that no single drive ran anywhere near 200,000 hours. The figure comes from pooling many units.
Example 5: a hypothetical packaging line
This one is illustrative, with invented numbers, to show the full workflow on plant equipment. Four identical case packers are each scheduled for 500 hours in a quarter, so 2,000 scheduled hours. Total downtime across all four is 40 hours, and your work orders show 8 unplanned failures.
- Operating time: 2,000 − 40 = 1,960 hours
- MTBF: 1,960 ÷ 8 = 245 hours
- Failure rate: 8 ÷ 1,960 ≈ 0.0041 failures per operating hour
Now compare by asset. If one packer accounts for 5 of the 8 failures, its own MTBF is far below the group average. That asset, not the group, is where the investigation starts.
Reading the result correctly
MTBF is not service life
The FDA’s technical guide states that MTBF is the average time a product operates before a failure occurs, that it covers only random failures and not wear-out, and that it should not be confused with the life of an item. An MTBF of 714 hours does not mean the pump lasts 714 hours or that it will run 714 hours before the next failure.
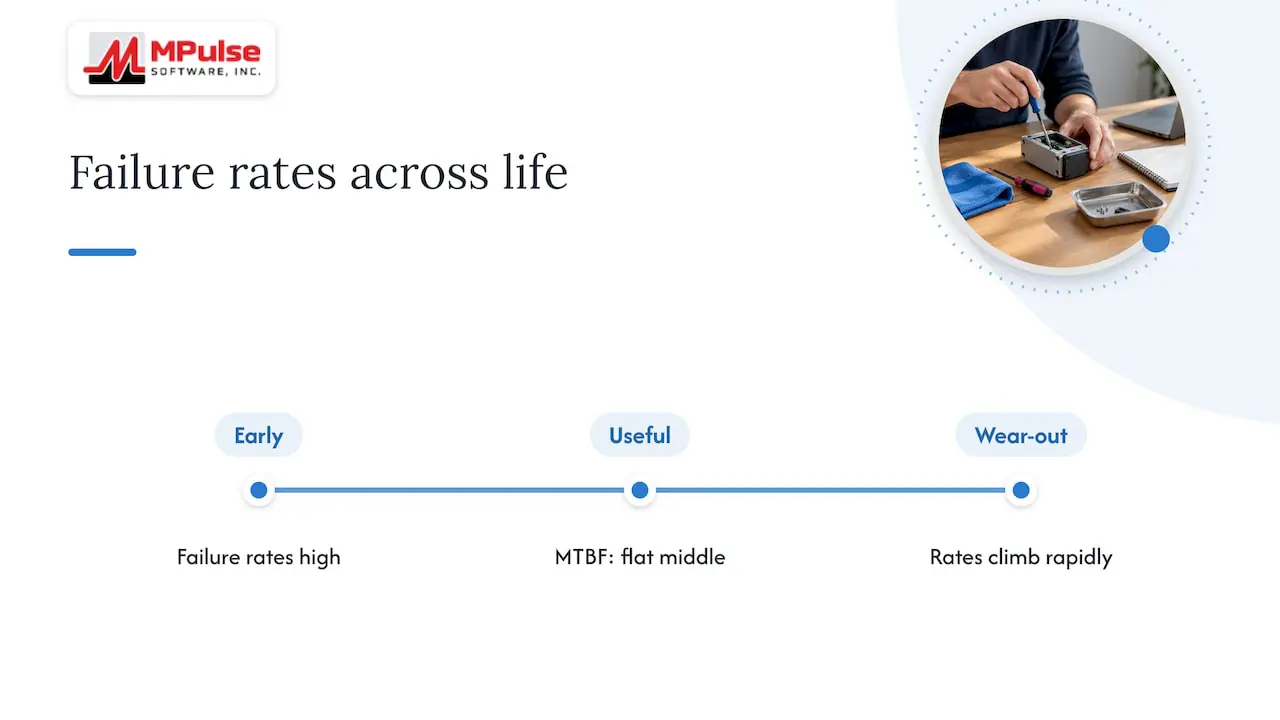
The same document describes the “bathtub” curve: failure rates are high early in life, relatively constant during useful life, and climb rapidly at wear-out. MTBF describes the flat middle. Seagate makes the same point: early and wear-out failures are not part of the rating, and MTBF is a barometer of reliability rather than a promise of trouble-free run time.
What MTBF implies about probability
When failures occur at a constant rate, the probability that an asset runs a period t without failing is e raised to the power of minus t divided by MTBF. For the 714-hour pump, the chance of running 100 hours without a failure is about 87%. The chance of running a full 714 hours without one is only about 37%. That second number surprises people, and it is the clearest way to explain why “MTBF” is not “time until it breaks.”
When MTBF is the wrong tool
If a component wears, so that failure probability rises with hours (belts, bearings, seals, brake linings), the constant-rate assumption breaks down and a single average will misrepresent risk. IEEE notes that the assumption holds in the stable operating phase and fails during burn-in and wear-out. For wearing parts, schedule replacement by runtime or condition instead. Our guide to runtime-based maintenance covers how to set those triggers.
MTBF, MTTR and MTTF compared
These three metrics are often confused, and each answers a different question.
| Metric | Question it answers | Applies to | Formula |
|---|---|---|---|
| MTBF | How long does a repairable asset run between failures? | Repairable assets | Operating time ÷ failures |
| MTTR | How long does a repair take? | Repairable assets | Total repair time ÷ number of repairs |
| MTTF | How long until a non-repairable item fails? | Non-repairable items | Total operating time ÷ items failed |
OSTI’s training material defines MTTR as the average time to correct a failure and return the system to its intended function. TI’s reliability terminology page notes that MTBF is effectively mean up-time between failures, because it does not include repair time. IEEE distinguishes MTBF for repairable systems from MTTF for non-repairable ones.
Because MTBF excludes repair time, you need both numbers to understand availability. An asset that fails rarely but takes days to repair can cost more downtime than one that fails often and is fixed in minutes. For the repair side, see our MTTR calculation guide and the four levers for MTTR reduction. If you want to measure the gap between repair events instead of failures, see MTBR tracking.
Common mistakes that distort MTBF
- Using calendar time. It inflates MTBF, as Example 3 shows.
- Changing the failure definition. Reliable Media warns that switching definitions partway through produces meaningless trends.
- Mixing planned and unplanned stops. Counting preventive maintenance as failures lowers MTBF and punishes the teams doing the right work.
- Pooling unlike assets. A fleet average hides the one machine that drives most failures. Calculate per asset, then roll up.
- Too little data. With two or three failures, one extra event swings the result sharply. Seagate notes that MTBF is based more on extrapolation than observation, which makes it risky to lean on for buy-or-keep decisions.
- Treating MTBF as a personnel score. An industry source quoted by Automation World describes it as much more an indicator of machine and asset performance than an assessment of people.
- Confusing it with life. Reliable Plant lists this as one of the biggest misconceptions: high MTBF figures rest on the failure rate during normal life, and there should be no correlation between service life and MTBF.
For formal qualification testing, the method is more rigorous. A test-and-evaluation journal article describes the classical approach: operating time divided by failures, with an exact confidence interval from the chi-squared distribution, and an 80% confidence level often used in U.S. Government testing. Plant teams rarely need that, but it shows why a point estimate from a handful of failures deserves caution.
Where MTBF is used
IEEE’s overview lists aerospace and defense reliability qualification, warranty cost modeling, preventive maintenance scheduling and spare parts inventory, network availability planning, and equipment procurement and lifecycle cost analysis. In a plant or facility, the day-to-day uses are narrower and practical:
- Prioritizing assets. Rank equipment by lowest MTBF and highest downtime impact. Our article on prioritizing maintenance tasks shows how to weigh criticality.
- Tuning preventive maintenance. If a machine fails about every two weeks, Automation World notes that this signals an opportunity to adjust planned downtime and PM tasks to bring the number up.
- Tracking improvement. MTBF can serve as a lagging indicator: if a reliability program works, the number should rise over time for similar equipment in similar conditions.
- Sizing spares. A known failure interval helps you stock the parts that fail most.
- Comparing like with like. Compare similar assets under similar duty, never a chiller against a conveyor.
Getting clean MTBF inputs
Most bad MTBF numbers come from bad inputs: runtime that is guessed, failures logged inconsistently, downtime entered as free text. Three habits fix that:
- Record runtime or meter readings per asset, rather than inferring hours from the calendar.
- Use a fixed failure-code list and a required field that separates planned from unplanned work.
- Log start and end times for every stoppage so downtime can be subtracted accurately.
Our guides on machine downtime tracking, how to calculate downtime and six-step data standardization for MTBF and MTTR go through each step. For the broader picture of what the metric means for a team, read what mean time between failures means for your team.
Our perspective
We see the same pattern in the maintenance teams we work with: the MTBF formula is never the problem. The inputs are. A team that divides a quarter’s calendar hours by a loosely counted list of breakdowns gets a number that looks precise and misleads every decision that follows.
That is why we built MPulse CMMS around the work order. When every failure is recorded against an asset with consistent codes, and preventive work is clearly separate from corrective work, MTBF becomes a by-product of daily work instead of a spreadsheet project at quarter end. Runtime-based triggers, a calendar view of scheduled work, and graphical reporting let a supervisor see which assets are failing, how often, and what the planned work is doing about it.
Our approach is to use MTBF as a prioritization tool, not a scorecard. Find the assets whose intervals are shortest, check whether the failure mode is random or wear-related, and then change the maintenance strategy: a tighter PM interval, a condition-based trigger, or a part change. In compliance-driven operations, the same records support audit readiness, because the history behind every number is already documented.
Mark
Put MTBF to work in MPulse
If you calculate MTBF in spreadsheets today, the next step is to capture the inputs where the work happens. MPulse CMMS combines preventive maintenance automation, work order management, asset tracking, calendar scheduling, and graphical reporting, so failure history and runtime sit in one system. Mobile access and barcode scanning help technicians log events at the asset.
The Professional plan is listed at $29 per month per user and the Advanced plan at $79 per month per user. See current plans and pricing for what each includes. If you need help with setup, data standardization or training, our implementation and training services are available.

Teams that want to bring in data from ERP or sensor systems can look at the DataLink integration adapter, which is one of the add-ons for connecting MPulse to other systems.
A short checklist before you publish an MTBF number
- The asset or group and the period are stated.
- Operating time is actual running time, with downtime subtracted.
- The failure definition is written down and unchanged from the last period.
- Planned stops are excluded.
- There are enough failures to make the average stable, or the number is flagged as provisional.
- The number sits beside MTTR and the cost or impact of downtime.
- Wearing components are managed by runtime or condition, not by MTBF alone.
FAQ
What is a good MTBF?
There is no universal good value. MTBF depends on the type of asset, its duty and how you define failure, so compare only similar equipment under similar conditions. Higher is better, and the most useful comparison is the same asset against its own history after a maintenance change.
Can I calculate MTBF if an asset has had only one failure?
Yes, mathematically: operating time divided by 1. But a single event makes the figure unstable. Treat it as provisional, and extend the measurement period or pool data from identical assets before using it for decisions.
Is MTBF the same as the expected life of equipment?
No. MTBF reflects random failures during the stable useful-life phase and excludes wear-out, as the FDA’s reliability guidance explains. An asset with a high MTBF can still wear out and need replacement long before that many hours.
How do MTBF and MTTR work together?
MTBF tells you how often a repairable asset fails, and MTTR tells you how long each repair takes. Together they show how much time an asset is available. Improving either one reduces downtime, so track both for critical equipment.
How is the failure rate related to MTBF?
When failure rate is constant, it is the reciprocal of MTBF. A 714-hour MTBF equals a failure rate of about 0.0014 failures per operating hour. Use the reciprocal only where the constant-rate assumption is reasonable.
Sources
- Reliability of Manufactured Products, FDA
- Mean Time Between Failure (MTBF), SECNAV guidebook entry
- Mean Time Between Failures, IEEE Technology Navigator
- How to Calculate MTBF and MTTR: Methodology and Worked Examples, Reliable Media
- b_TEC training material, OSTI
- Understanding Reliability Metrics, Seagate
- Reliability terminology, Texas Instruments
- Robust MTBF Test: A Classical Approach, ITEA Journal
- Mean Time Between Failure (MTBF) Explained, Reliable Plant
- Understanding MTTR and MTBF Maintenance Metrics, Automation World