
Risk-based maintenance (RBM) is a strategy that directs maintenance effort to the assets where a failure would do the most harm. It ranks each asset by two factors: how likely it is to fail and what happens if it does. Assets with high risk get more frequent and more thorough attention. Assets with low risk get less, which frees technicians, parts and budget for the equipment that matters most.
This guide explains how RBM works, how to score assets, the steps to put a program in place, what results look like in practice and how a CMMS keeps the program running after the analysis is finished.
TL;DR
- RBM multiplies the probability of failure by the consequence of failure to give each asset a risk score, then sets maintenance effort by that score.
- It differs from condition-based maintenance (CBM) because it weighs consequences such as safety, environment and production, not only equipment condition.
- A workable program has three parts: risk determination, risk evaluation and maintenance planning.
- Published case studies report large reductions in inspection scope and cost, but results depend on the quality of your risk model and your assumptions.
- A CMMS holds the criticality scores, schedules the resulting tasks and records the history you need to re-score assets over time.
Table of Contents
- What risk-based maintenance is
- How RBM compares with PM, CBM and RCM
- How to assess criticality and risk
- Steps to implement a risk-based maintenance program
- What results look like in practice
- Benefits of risk-based maintenance
- Setting RBM up so the results hold
- Where a CMMS fits
- Promo: put risk-based priorities into your daily schedule
- Perspective
- FAQ
- Sources
What risk-based maintenance is
RBM treats maintenance as a risk-management decision. A 2003 academic paper on a quantitative RBM approach describes the logic: high and medium risk areas get focused maintenance effort, while low-risk areas get minimized effort, which reduces the total scope and cost of the program in a structured and justifiable way.
The word “justifiable” matters. In many plants, preventive maintenance (PM) schedules grow over time. Tasks are added after a failure, copied from a manufacturer’s manual or carried over from a previous site. Few are ever removed. RBM gives you a documented reason for each interval and each skipped task, which helps during audits and budget reviews.
A 2021 comprehensive review of RBM notes that RBM aims to minimize the probability of system failure while limiting its consequences by integrating maintenance with safety. Its plans concentrate effort on high-risk components, which are maintained more often than low-risk devices.
The risk formula
The core calculation is simple. In a utility setting, the probability of a failure event is multiplied by the impact that event can have, which accounts for safety threats and other hazards. EPRI’s guideline for ranking power plant systems uses the same definition: risk is the consequence of failure multiplied by the probability of failure.
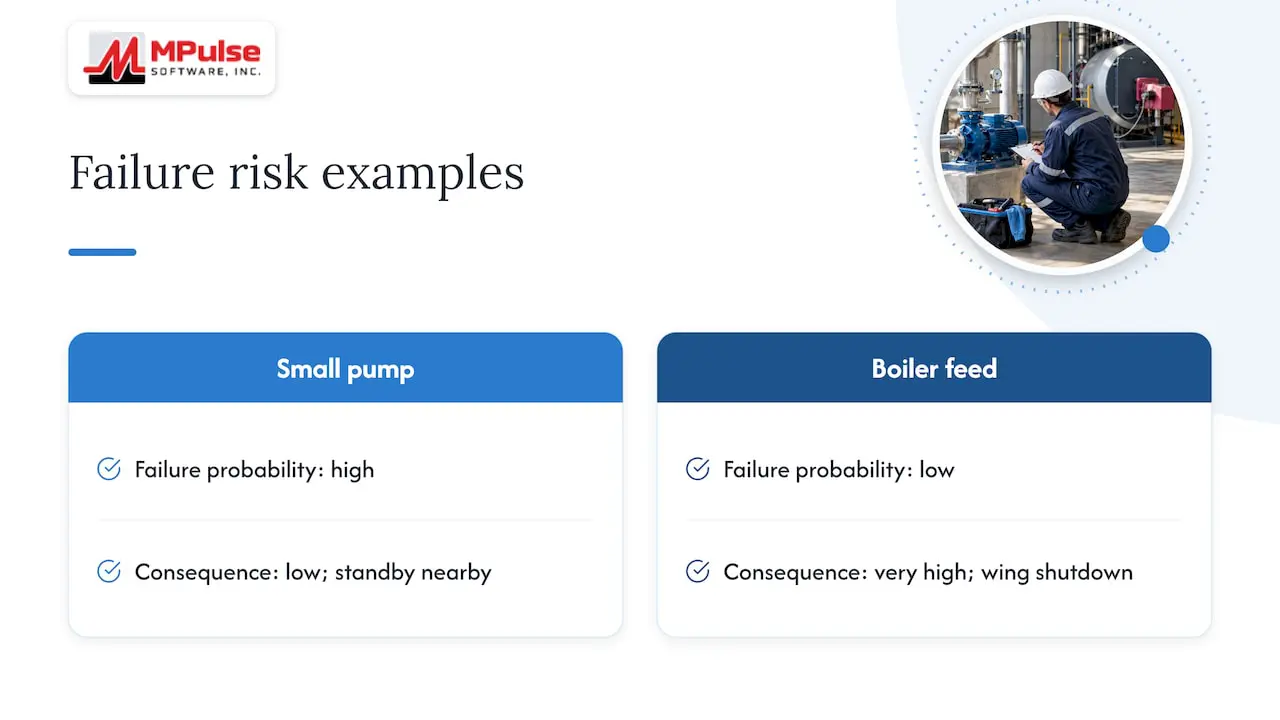
Two assets show why this matters. A small pump that fails often but sits next to a standby unit has a high probability and a low consequence. A rarely failing boiler feed system that would shut down a hospital wing has a low probability and a very high consequence. RBM compares them on the same scale, so neither is judged by failure count alone.
How RBM compares with PM, CBM and RCM
RBM is not a replacement for the other strategies. It decides where each of them belongs.
| Strategy | What triggers the work | What it answers |
|---|---|---|
| Preventive (time-based) | Calendar or meter interval | Is it due? |
| Condition-based (CBM) | Monitoring data crossing a threshold | Is it deteriorating? |
| Risk-based (RBM) | Risk score from likelihood and consequence | How much does it matter if it fails? |
| Reliability-centered (RCM) | Failure mode analysis per asset | What should each asset do and how can it fail? |
RBM and condition-based maintenance
CBM tells you when an asset needs work. RBM tells you which assets deserve a monitoring investment in the first place. INMR explains that RBM also takes into account the consequences of dysfunction, measured in business values such as safety and security of supply. The two work together: rank assets by risk, then apply condition monitoring where the score justifies it.
If you already run sensors or meter readings, MPulse supports condition-based maintenance, so a reading that crosses a limit can trigger the right work order for a high-risk asset.
RBM and reliability-centered maintenance
The two approaches differ in direction. RBM takes a top-down view of a facility, using matrices to rank assets, while RCM works from the ground up on what each asset must do and what could cause it to fail. A criticality matrix can serve as the first step inside an RCM effort, so you do not analyze every asset in depth.
How to assess criticality and risk
The hardest part of RBM is putting numbers on likelihood and consequence. The EPRI guideline notes that the most challenging part is determining a component’s current probability of failure, and some utilities study 30 years of failure history to build failure curves. Most facilities do not have that much data, and they do not need it to start. Work order history, expert judgment and manufacturer data are enough for a first pass.
A scoring example
One published approach, the Equipment Criticality Assessment, multiplies a Total Consequence Number by a Frequency/Probability Number to get a Relative Risk number. Total Consequence is the sum of values assigned to safety, environmental, quality, throughput, customer service and operating cost.
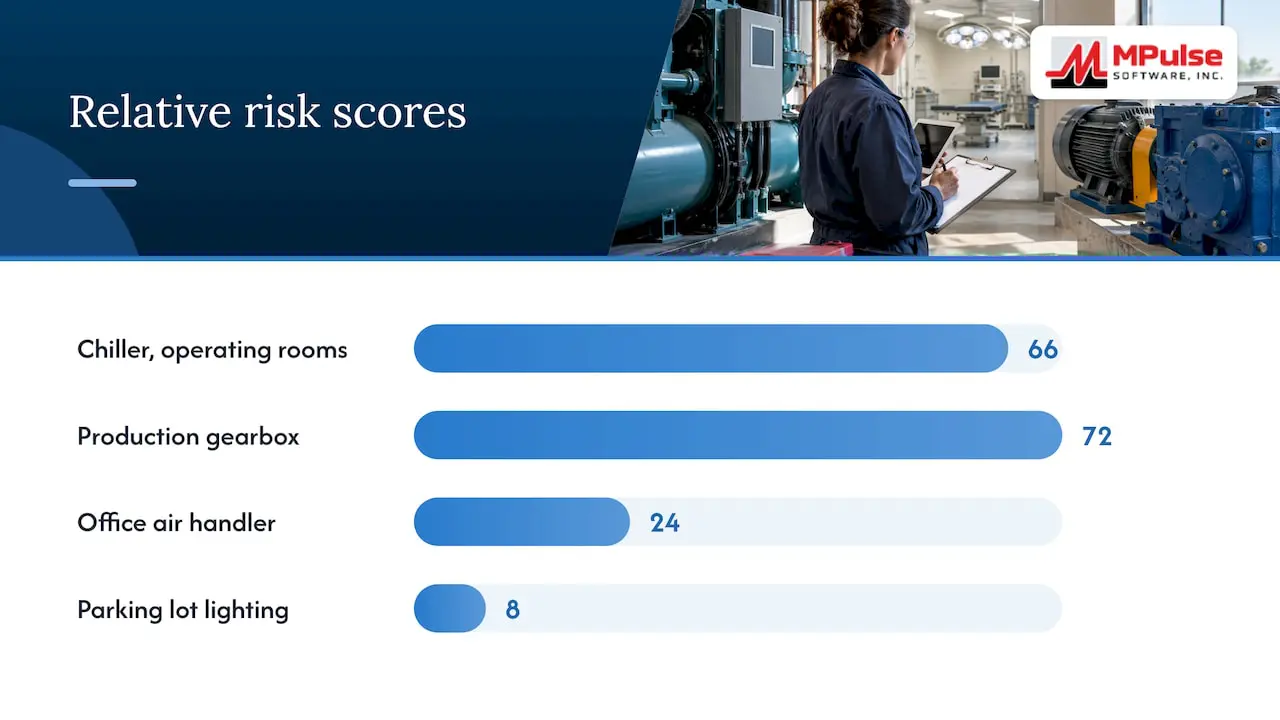
Here is an illustration with made-up scores on a 1 to 5 scale, meant to show the mechanics and not to serve as a benchmark:
| Asset | Consequence (sum of categories) | Probability | Relative risk | Maintenance approach |
|---|---|---|---|---|
| Chiller serving operating rooms | 22 | 3 | 66 | Condition monitoring, tight PM interval, critical spares on site |
| Production line gearbox | 18 | 4 | 72 | Condition monitoring plus planned overhaul |
| Office air handler | 8 | 3 | 24 | Standard PM |
| Parking lot lighting | 4 | 2 | 8 | Run to failure with inspection rounds |
The point is the spread. Once scores are in the system, the gap between 72 and 8 makes it easy to defend a different strategy for each asset.
MPulse includes asset criticality and RIME scoring, so the ranking sits on the same asset record as the work history. For a rollout plan, see our guide to embedding asset criticality in a CMMS in 90 days.
Steps to implement a risk-based maintenance program
Academic work splits the method into three modules: risk determination (identification and estimation), risk evaluation (risk aversion and acceptance) and maintenance planning that takes the risk factors into account. A Norwegian RCM report puts the goals in similar terms: analyze the risk, evaluate it by ranking against acceptance criteria, and develop strategies covering condition monitoring, repair and replacement. In a facility, that translates into the following steps.
- Build the asset inventory. Every asset needs a unique record with location, parent system, nameplate data and history. Gaps here undermine every later step.
- Define your consequence categories. Choose the categories that reflect your operation: safety, environmental, regulatory, production, patient or occupant impact, repair cost. Agree on what a 1 and a 5 mean in each.
- Estimate probability of failure. Use work order history, mean time between failures (MTBF), age, operating conditions and technician knowledge. The same report describes tools such as fault tree analysis for causal analysis and event tree analysis for consequences when you need more rigor.
- Calculate and rank risk. Combine the two factors and sort. Review the top and bottom of the list with operations staff, since they will spot scores that do not match reality.
- Set the risk acceptance criteria. Decide which scores require action, which need monitoring and which can be accepted.
- Select maintenance tasks for each tier. High-risk assets might get condition monitoring, shorter PM intervals and redundancy checks. Low-risk assets might get visual rounds or planned run to failure.
- Schedule and resource the work. Link tasks to criticality and MTBF, and plan labor, parts and contractor time to match.
- Review on a cycle. Re-score after major incidents, equipment changes or process changes, and on a regular cadence such as quarterly or annually.
Plan spares and contractors by risk
Risk scores should also guide what you stock and who you call. High-consequence assets justify holding critical spares even when failures are rare. Our article on expected value critical spares planning shows how to weigh this. For work that needs outside help, contractor maintenance scheduling strategies cover how to cut downtime when specialists are involved.
What results look like in practice
Most published RBM results come from process industries, where the method is often applied as risk-based inspection (RBI). They show the scale of change that is possible, not a guarantee for your site.
- Chemical plant, U.S. Gulf Coast. A plant that converted from a conventional API inspection program to RBI reported a 65% reduction in inspection requirements and an estimated $3.2M reduction in maintenance cost, with projected savings of $8M over 10 years from longer turnaround intervals.
- Gas liquids facility, Saudi Arabia. A quantitative RBI study using API methods extended the turnaround and inspection date for components by two years, saving approximately $3.4 million in inspection and business interruption cost.
- Oil field rotating equipment, Indonesia. A 2026 case study screened an inventory down to 42 critical units, then 30 for detailed analysis, and converted 26 failure modes into 13 on-condition, 8 restoration and 5 failure-finding tasks. Assessed risk moved from mostly intolerable to tolerable levels.
The Indonesian study offers a useful lesson for any team: Pareto screening limited the detailed analysis to the assets that mattered. You do not need to analyze every light fixture.
For a deeper look at the cost side, our guide on calculating the value of maintenance walks through a method you can apply to your own tasks.
Benefits of risk-based maintenance
The Norwegian RCM report lists the benefits of RBM as optimizing maintenance resources, scope and time, supporting decisions on extending the life of ageing equipment, helping asset integrity management, and reducing the probability of unexpected failure and unplanned shutdown. For a facility team, this usually shows up as:
- Fewer low-value PM tasks competing for technician hours.
- More attention on the equipment that stops production, endangers people or threatens compliance.
- A documented rationale for intervals, which supports audit readiness.
- Better capital planning, since risk scores show which aging assets need replacement first.
Setting RBM up so the results hold
RBM depends on the quality of its inputs, so a few practices keep the program reliable.
Fit the risk target to the model. Research on quantitative risk models finds that a risk target should be set according to the deployed risk model. Reusing one target across different models can miss equipment that needs more resources or spend effort on equipment that does not. The Norwegian report adds that results are sensitive to analyst assumptions, so the configuration of the risk matrix should follow the model and the target you establish.
Define the value you are protecting. RBM aims at overall performance in terms of corporate values such as safety, liability and financial impact, which may or may not be easy to monetize. Decide up front how your organization weighs them, and keep the weighting consistent across sites.
Involve operations and maintenance together. Technicians know how assets fail. Operations staff know what a failure costs. Scoring sessions with both groups produce numbers people trust.
Keep the data clean. Failure codes, accurate work order closeouts and consistent asset naming turn your history into probability estimates. A CMMS makes this routine instead of a clean-up project.
Prioritize daily work with the same logic. A risk ranking should shape the work queue too. Our guide to prioritizing maintenance tasks with a matrix shows how to apply it to incoming requests.
Where a CMMS fits
A spreadsheet can hold a first risk ranking. It struggles to keep the ranking alive. A CMMS connects each score to the asset, its tasks, its parts and its history, so the ranking changes when the facts change.
In practice, a CMMS supports an RBM program by:
- Storing criticality scores on each asset record.
- Generating preventive and condition-based work orders from the intervals you set for each risk tier.
- Tracking failures, downtime and costs so probability estimates improve with every closed work order.
- Managing spare parts inventory for high-consequence assets.
- Producing reports that show the effect of the program and support compliance recordkeeping.
Promo: put risk-based priorities into your daily schedule
MPulse CMMS combines asset criticality scoring, preventive maintenance automation, condition-based maintenance, inventory and a calendar interface in one system, so your risk ranking drives the work your team actually does. More than 3,500 customers worldwide use it, and the Professional edition is listed at $29 per user per month, with Advanced at $79 per user per month.
See the plans and pricing to compare editions. If you want help with setup, our implementation, training and consulting services cover moving asset data and criticality rankings into the system.
Perspective
Most maintenance teams we talk to do not lack a strategy. They lack a way to keep the strategy current. A criticality ranking built in a workshop is useful on the day it is made, and then equipment changes, processes change and the ranking drifts away from reality.
That is why we build risk thinking into the work order system itself. When criticality sits on the asset record, the schedule, the spare parts list and the reports all draw on the same score. The calendar shows technicians what to do first, and managers can show auditors why.
Our advice is to start small. Score your top 50 assets, set tiers, apply the right task types to each tier and review after a quarter of real work order data. Teams that do this in a CMMS tend to find that the second pass is faster and more accurate than the first, because the history is already there.
Mark
FAQ
What is the difference between risk-based maintenance and preventive maintenance?
Preventive maintenance works on a fixed interval, such as every 90 days, for any asset it covers. Risk-based maintenance sets those intervals and task types according to risk, so critical assets get more attention and low-risk assets get less. Many teams use RBM to decide how their preventive maintenance program should be shaped.
What does RBM stand for in maintenance?
RBM stands for risk-based maintenance. You may also see RBI, risk-based inspection, which applies the same logic to inspection programs for equipment such as pressure vessels and piping. Both rank assets by the likelihood and consequence of failure to focus effort where risk is highest.
How often should risk rankings be reviewed?
Review them on a regular cadence and after any event that changes risk, such as a major failure, an equipment modification or a process change. Many teams choose a quarterly or annual cycle. Closed work orders and failure codes in your CMMS supply the data for updating probability scores.
Do I need sensors to do risk-based maintenance?
No. You can start with work order history, technician knowledge and manufacturer data to estimate probability, and with operational impact to estimate consequence. Sensors and condition monitoring become worthwhile for high-risk assets, where early warning of deterioration reduces the chance of a costly failure.
Which facilities benefit most from RBM?
Facilities with many assets and limited maintenance resources benefit most, especially those where failures carry safety, compliance or production consequences. Manufacturing plants, hospitals, campuses and multi-site operations all fit that description, since ranking by risk lets a small team cover a large inventory.
Sources
- Risk-based maintenance (RBM): a quantitative approach, 2003
- On risk-based maintenance: a comprehensive review, 2021
- Asset Replacement Strategies in Ageing Grids, INMR
- EPRI guideline for establishing criticality rankings
- Single Point Lesson: Equipment Criticality Analysis, Reliable Plant
- Reliability Centered Maintenance report, 2014
- Risk-based inspection yields big savings for a Gulf Coast chemical plant
- Risk-based inspection study, MENDT 2015
- Risk-Based Reliability-Centered Maintenance (RCM3) case study, 2026
- Reliability of quantitative risk models, 2022
- How to Implement Reliability-Centered Maintenance