
Asset criticality analysis ranks equipment by the risk its failure poses to safety, production, and cost, producing a tiered list you can act on immediately. That output directly drives what gets preventive maintenance, predictive monitoring, spare parts on the shelf, or a full FMEA review. It borrows its risk logic from frameworks like ISO 31000 and the reliability-engineering RPN concept, and it works best when the results live inside a CMMS like MPulse Software rather than a spreadsheet nobody opens twice. For the fundamentals, see equipment maintenance explained.
TL;DR:
- Asset criticality scoring should prioritize safety and environmental impacts over cost, especially in heavy process industries.
- Scoring involves multiplying consequence and likelihood, normalized to a 100-point scale, with the worst realistic failure mode driving the score.
- Criticality tiers guide maintenance strategies, with the most critical assets receiving condition monitoring and spare parts, while less critical assets may follow a run-to-failure approach.
- Embedding criticality in the CMMS and automating based on its results ensures ongoing relevance, with IoT sensors triggering automatic work orders for Tier 1 assets.
- Keeping the process simple, cross-functional, and reviewed regularly enhances accuracy and ensures the analysis influences maintenance actions effectively.
Table of Contents
- What Is Asset Criticality Analysis and Why Does It Matter?
- How Do You Score Asset Criticality?
- How Do You Run an Asset Criticality Analysis Step by Step?
- How Do You Map Criticality Tiers to Maintenance Strategy?
- How Should You Visualize and Report Criticality Results?
- How Do You Embed Criticality Analysis Into Your CMMS?
- What Mistakes Should You Avoid With Criticality Analysis?
- Implementing Criticality Analysis at Scale: The First 90 Days
- Put Criticality Results to Work With MPulse CMMS
- Sources
- FAQ
What Is Asset Criticality Analysis and Why Does It Matter?
Asset criticality analysis assigns every piece of equipment a rating based on what happens when it fails. That rating draws on multiple consequence categories, not just downtime cost, and it follows the risk logic behind ISO 31000: identify the hazard, weigh the consequence, weigh the likelihood, then act on the highest exposures first.
Most programs assess consequence across six areas, and cross-functional teams typically weigh safety and environmental impact more heavily than pure cost:
- Safety: injury potential to operators or nearby personnel
- Environmental: spill, emission, or regulatory exposure
- Production: output loss during downtime
- Quality: scrap, rework, or customer complaints tied to the failure
- Cost: repair, replacement, and secondary damage expense
- Customer impact: missed shipments, service level breaches, contract penalties
The payoff is focus. Instead of spreading preventive maintenance evenly across a plant, you concentrate technician hours, spare parts inventory, and capital budget on the assets whose failure actually hurts. That focus shows up directly in KPIs maintenance managers already track: mean time to repair, PM compliance percentage, and unplanned downtime hours per critical unit.
How Do You Score Asset Criticality?
The standard formula multiplies a weighted consequence score by a likelihood score: Criticality = Consequence × Likelihood. Some programs add a third factor, Detectability, borrowed from the RPN calculation used in FMEA, producing Criticality = Consequence × Likelihood × Detectability when early-warning signals matter.
Consequence is rarely a single number. It’s a composite built from the six categories above, each scored on a 1-5 or 1-10 scale, then combined using fixed weights.
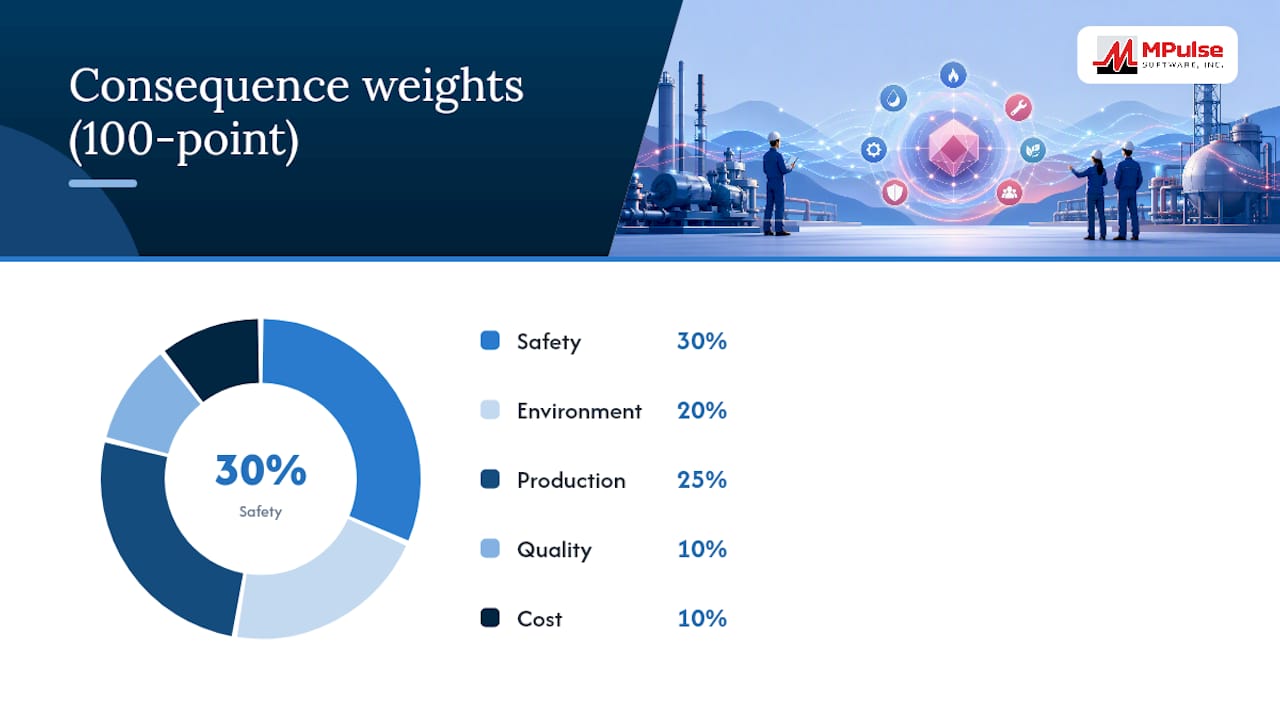
Statistic to anchor your model: formal criticality programs normalize consequence weights to a 100-point scale, so Safety might carry 30 points, Environment 20, Production 25, Quality 10, Cost 10, and Customer Impact 5. Changing weights mid-analysis invalidates every comparison you’ve already made.
Practical scoring steps:
- Define scoring scales for each consequence category with concrete examples at each level (a 5 in Safety might mean “potential fatality,” a 2 might mean “first aid only”).
- Set category weights based on your industry. Heavy process industries typically weight Safety and Environment higher, while discrete manufacturers often weight Quality more.
- Score likelihood using failure history, run hours, or engineering judgment on a matching scale.
- Multiply weighted consequence by likelihood to get the raw criticality score.
- Normalize scores across the asset population so tiers are comparable plant-wide.
One detail trips up a lot of teams: which failure mode do you score? The answer is the maximum reasonable outcome, not every possible failure mode for that asset. A pump might fail a dozen ways, but you score the worst realistic consequence, the one that would actually change how you maintain it, and save the full failure-mode breakdown for FMEA later.
A risk scoring framework built for other domains follows the identical logic: consequence times probability, weighted by what the organization actually cares about.
How Do You Run an Asset Criticality Analysis Step by Step?
Running an equipment criticality assessment is a workshop process, not a solo spreadsheet exercise. Skipping steps here is the fastest way to end up with numbers nobody trusts.
- Validate the asset hierarchy. Pull CMMS histories, spare parts records, and functional descriptions for every asset you plan to score. Gaps here corrupt every score downstream.
- Select a pilot sample. Choose 40 to 100 assets that represent your full range of equipment types and risk profiles. Operivo’s implementation guidance recommends this range specifically to calibrate the scoring model before committing to plant-wide rollout.
- Run the assessment workshop. Bring Operations, Maintenance, EH&S, and Engineering into the same room. Each function sees different consequences, operators know the safety risk, engineers know the failure mechanism, and consensus scoring catches blind spots any single department would miss.
- Record detailed assessments without publishing final tiers yet. Capture every category score, but hold back the computed criticality result while you refine the aggregation model. This avoids defensiveness before the math is settled.
- Build the aggregation model. Lock your weights, add logical constraints (a maximum safety score should never be diluted by a low cost score), and check the resulting distribution.
- Check your distribution against expectations. A healthy pilot should land 5 to 15% of assets in the top-critical tier. If 40% of your pilot lands there, your scoring scale is too generous.
- Roll out to the full asset base, then embed the results in your CMMS so they drive real work.
Pro Tip: Run the pilot on a mix of “obviously critical” and “obviously non-critical” assets first. If your model doesn’t separate those cleanly, fix the weights before you touch the ambiguous middle of your asset base.
How Do You Map Criticality Tiers to Maintenance Strategy?
Scores only matter once they change what technicians do. A three-tier structure works for most plants, though some add a fourth tier for truly catastrophic-consequence assets.
- Tier 1 (top critical assets, typically a minority of the asset base): Highest criticality. These assets justify RCM or FMEA analysis, condition monitoring, and guaranteed spare parts on hand. Running full RCM here is worth the labor cost; running it plant-wide is not.
- Tier 2 (mid-range, often 20-40%): Moderate criticality. Standard time-based preventive maintenance, periodic inspection, and spares sourced on a defined lead time rather than stocked.
- Tier 3 (remaining assets): Low criticality. Run-to-failure or minimal PM is often the economically correct choice. Spending technician hours here instead of Tier 1 is a resource misallocation.
One rule matters more than the tier cutoffs themselves: a single-category severity score, particularly Safety or Environment, should be able to override a low aggregate score to ensure critical hazards are prioritized. An asset with a moderate overall number but a maximum safety rating still belongs in Tier 1. This is the logical constraint that keeps a weighted average from quietly hiding a real hazard.
Tier assignments also drive concrete resource decisions. A Tier 1 conveyor motor might get vibration monitoring and a spare held in local inventory. A Tier 3 motor of the identical model, installed on a redundant line, might sit on run-to-failure with no dedicated spare at all. Same equipment type, opposite strategy, entirely because of criticality.
How Should You Visualize and Report Criticality Results?
A consequence-by-likelihood risk matrix is the fastest way to make criticality legible to people who weren’t in the scoring workshop. Plot consequence on one axis, likelihood on the other, and color-band the quadrants: red for immediate action, yellow for scheduled attention, green for monitor-only. Risk matrix tools built into APM platforms follow this exact structure to combine criticality with live asset health data.
Pareto charts do the persuasion work for budget conversations. Rank assets by criticality score and you’ll typically find a small percentage account for the majority of your total risk exposure, which is the argument that gets a capital request approved.
Monetizing the analysis closes the loop. Convert each asset’s annualized failure probability and consequence cost into a dollar figure, then you’re comparing OPEX (more frequent PM) against CAPEX (replacement or redundancy) on the same financial terms leadership already uses.
For reporting:
- Export tier assignments and scores to your CMMS asset records, not a standalone file.
- Build a dashboard view filtered by tier for maintenance planning meetings.
- Refresh the underlying data on a fixed review cadence, not only when someone remembers to.
How Do You Embed Criticality Analysis Into Your CMMS?
Criticality analysis that lives in a spreadsheet gets used once and forgotten. Embedding results directly in your CMMS is what keeps the assessment evergreen instead of a one-time audit exercise.
Practical fields to add to each asset record:
- Criticality tier (1, 2, or 3) and the underlying composite score
- Last assessment date and next scheduled review date
- Individual consequence category scores for audit traceability
- Linked spare parts classification and PM template assignment
Once those fields exist, tier should mechanically drive behavior: Tier 1 assets get shorter PM intervals, priority in the work order queue, and condition-based monitoring where sensors are available. Tier 3 assets get longer intervals and lower work order priority by default.
IIoT integration adds real teeth here. A vibration sensor on a Tier 1 pump can trigger a condition-based work order automatically, rather than waiting for a fixed calendar interval that might fire too early or too late. Some CMMS platforms can hold criticality values directly in asset records, automate PM scheduling around tier, and pull in condition data from connected sensors, which is the practical mechanism that turns a criticality score into a maintenance action instead of a static report.
Pro Tip: Set your review cadence before you finish the pilot. Annual review works for stable operations; anything with high failure-rate volatility needs a semiannual check instead.
What Mistakes Should You Avoid With Criticality Analysis?
Overcomplicating the model kills more programs than getting the math wrong. A twelve-category weighted scoring system with three sub-factors each sounds thorough, but if your team can’t apply it consistently in a workshop, the scores become noise. Match model complexity to what your organization can sustain, not what looks impressive in a slide deck.
Scoring every failure mode for every asset is another time sink that rarely pays off at the criticality stage. Score the maximum reasonable outcome per asset, then save the granular failure-mode breakdown for FMEA on your Tier 1 list.
Bias creeps in fast when one department scores alone. A maintenance manager will weight cost differently than an EH&S lead weights environmental exposure. Cross-functional pilots with documented sign-off from Operations, Maintenance, EH&S, and Engineering catch that skew before it hardens into policy.
- Lock weights before scoring starts, not after seeing preliminary results.
- Publish the aggregation model and constraints so scoring isn’t a black box.
- Require the results to change something in the CMMS within 30 days, or the exercise wasn’t worth running.
Implementing Criticality Analysis at Scale: The First 90 Days
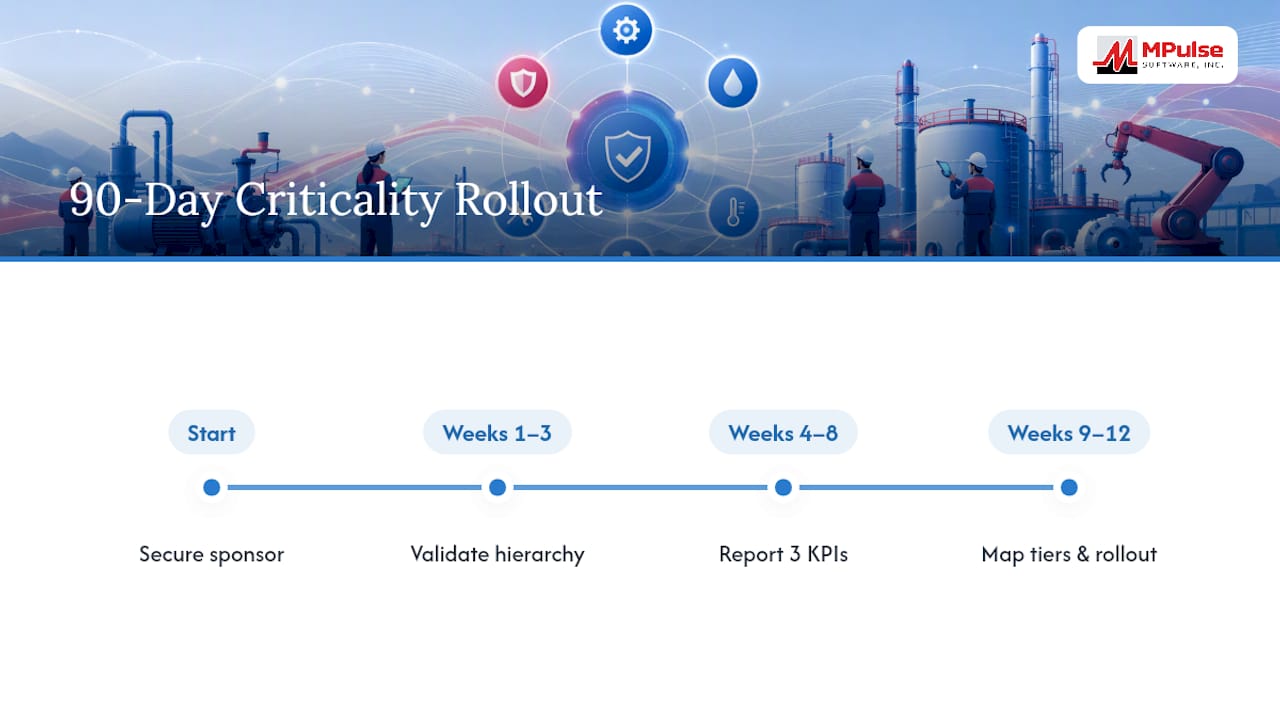
The programs that stick share a pattern: they treat the first 90 days as infrastructure work, not a reporting exercise. Week one to three, validate your asset hierarchy in the CMMS. Week nine to twelve, map every tier to a CMMS field and a PM rule, then roll out.
The single biggest predictor of failure isn’t the math. It’s the absence of an executive sponsor who forces the cross-functional workshop to actually happen instead of becoming a maintenance-only exercise.
Report three numbers early to keep sponsorship alive: unplanned downtime hours on Tier 1 assets, PM compliance percentage, and mean time to repair. Those move fast enough in 90 days to prove the program is worth funding past the pilot.
— Mark
Put Criticality Results to Work With MPulse CMMS
A criticality analysis that stays in a spreadsheet after the workshop ends is analysis without action. Certain CMMS solutions give maintenance managers the place to put those tier assignments to work: asset records that hold criticality scores and review dates, PM templates that automatically adjust to tier, and dashboards that turn a risk matrix into something the whole team checks regularly instead of once a year.
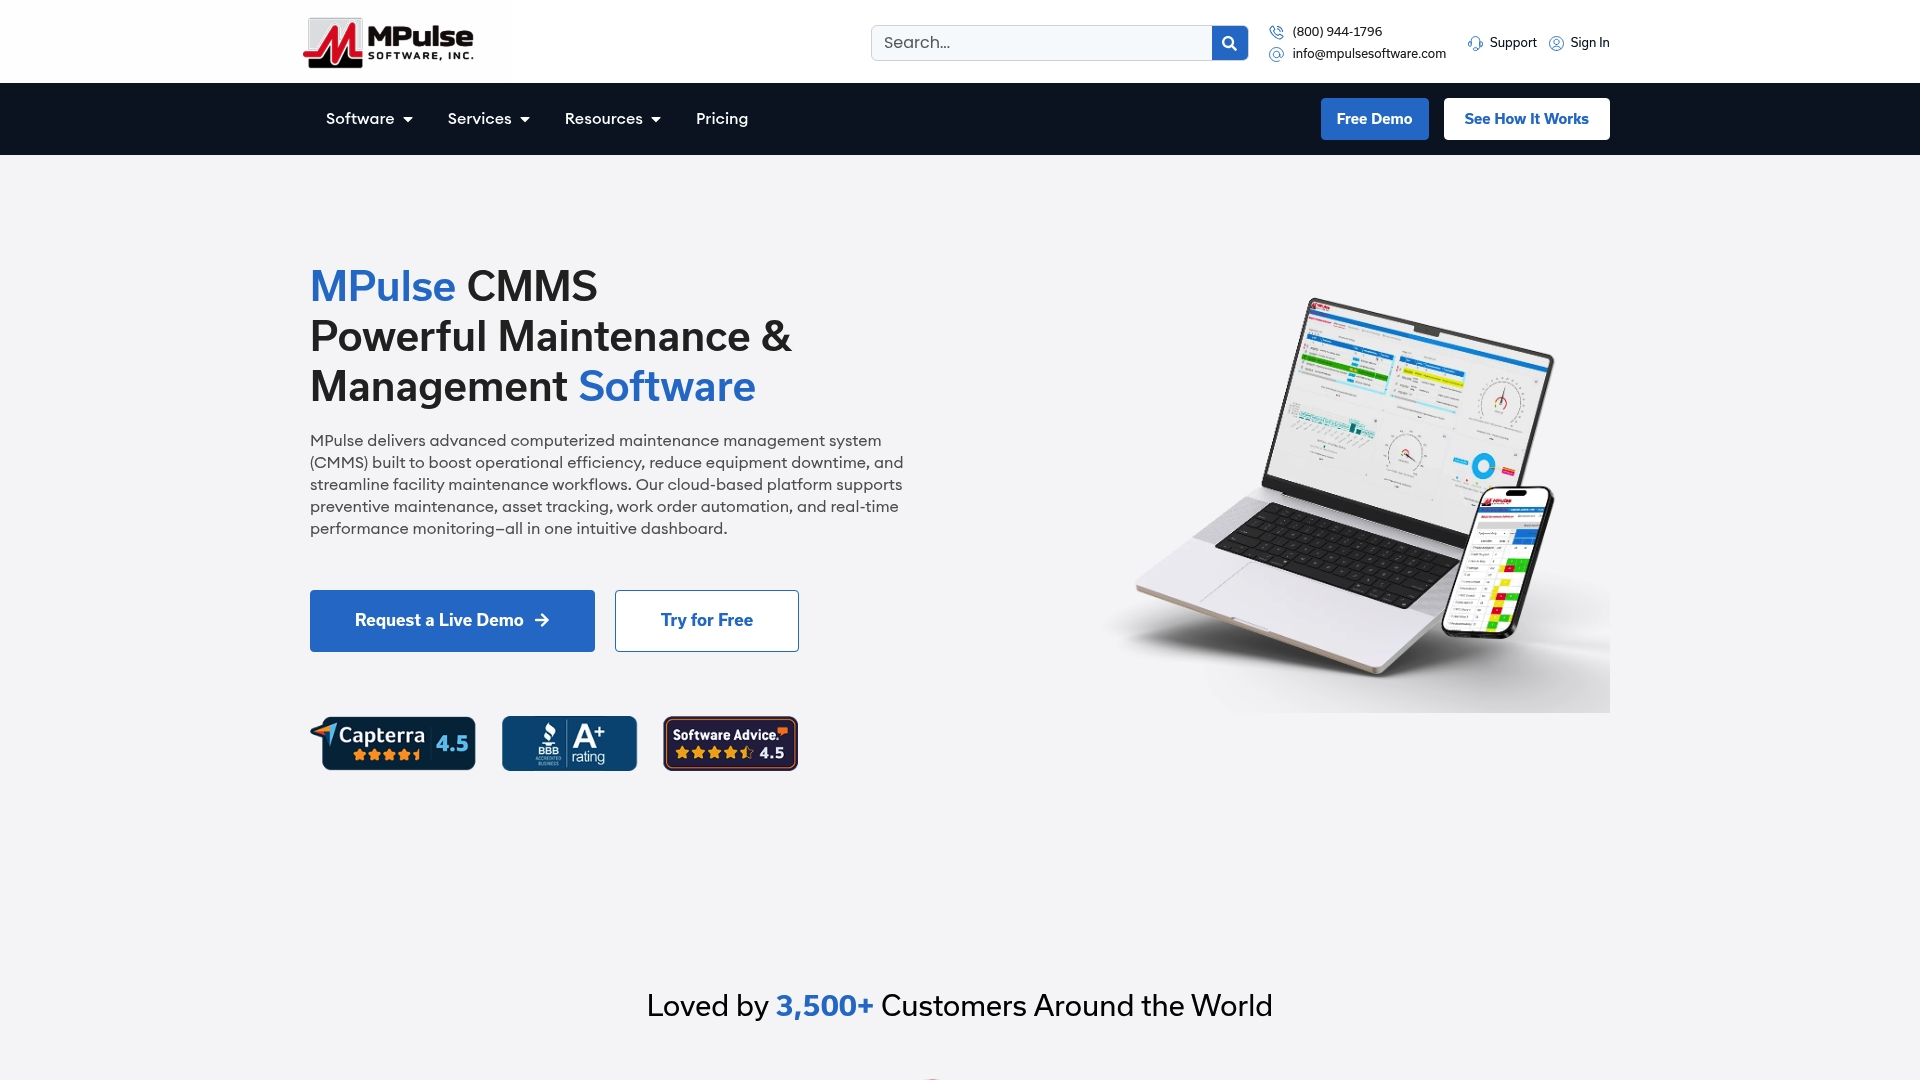
The platform’s calendar interface schedules PM around the intervals your Tier 1 assets actually need, while IIoT integration pulls condition data straight into work order triggers for the equipment where sensors justify it. If your criticality analysis is finished but your CMMS still treats every asset the same way, that gap is costing you. Explore MPulse CMMS and see how tiered results map directly into your maintenance workflow.
Sources
- Criticality Analysis: What It Is and Why It’s Important
- How to Calculate Asset Criticality
- How to Implement Asset Criticality Assessment (ACA)
- Criticality analysis (LCE guidance PDF)
FAQ
What Is the Difference Between Asset Criticality Analysis and FMEA?
Asset criticality analysis ranks your entire asset base by risk to identify which equipment deserves deeper attention.
How Many Assets Should Be in the Pilot Sample?
Most implementation guidance recommends 40 to 100 assets for the pilot, chosen to represent your full range of equipment types and risk levels before calibrating the model plant-wide.
What Percentage of Assets Should Land in the Top-Critical Tier?
A well-calibrated model typically places 5 to 15% of assets in the top-critical tier. If your results show a much larger share, your scoring scale likely needs tightening.
Can a CMMS Store and Automate Asset Criticality Results?
Yes. A CMMS like MPulse can hold criticality tiers and scores directly in asset records, then use that tier to automate PM scheduling, work order priority, and spare parts classification.
How Often Should You Review Asset Criticality Scores?
Review cadence depends on operational volatility, but an annual review is standard for stable operations, with semiannual reviews recommended where failure rates or process conditions change frequently.