
IoT sensor integration means connecting physical sensors to a data pipeline that feeds usable telemetry into enterprise systems, not just getting a device online. The reliable pattern is edge or gateway aggregation, a lightweight protocol like MQTT or MQTT‑SN, secure cloud ingestion, and mapping that data into systems such as a CMMS or ERP. Done right, it produces the kind of telemetry that triggers automated work orders and feeds predictive maintenance instead of sitting in a dashboard nobody checks.
TL;DR:
- Most sensor integration value comes from data normalization, routing, and actionable system entry, not just connecting sensors to Wi‑Fi.
- Gateway protocols should perform filtering and anomaly detection locally to reduce bandwidth use and alert fatigue downstream.
- Protocol choice depends on device power, memory, and latency needs, with MQTT- SN and LoRaWAN suited for constrained nodes and wide-area networks.
- A 60 to 90 day pilot spanning a full duty cycle is essential to identify seasonal issues before scaling up.
- Connecting sensor data to existing enterprise systems requires standard gateways and middleware to avoid disruptive custom rework.
Table of Contents
- What Does IoT Sensor Integration Actually Involve?
- Core Components and Architecture Patterns
- How Do You Choose Between MQTT, CoAP, and LoRaWAN?
- Implementation Checklist: From Scoping to Rollout
- What Challenges Come Up During Sensor Integration?
- Industry Applications: Where Sensor Integration Pays Off
- Data Format Standards and Serialization for Sensor Data
- Connecting Sensor Data to SCADA, ERP, and Cloud Systems
- Turning Sensor Data Into Something a Team Actually Uses
- MPulse’s CMMS-First Approach to Sensor Integration Pilots
- Standards and Guides Worth Bookmarking
- Where MPulse Software Fits Into Your Sensor Integration Plan
- Sources
- FAQ
What Does IoT Sensor Integration Actually Involve?
Connecting a sensor to Wi‑Fi is the easy part. Integration is what happens after: normalizing that reading, routing it through a broker, and getting it into a system where a human or an automated rule can act on it. A vibration sensor that streams data to a local dashboard has connectivity. The same sensor triggering a work order in a maintenance system when amplitude crosses a threshold has integration.
That distinction determines whether the project delivers value or just generates logs. The business benefits of IoT integration tend to cluster around a few outcomes:
- Real-time visibility into asset condition, environmental status, or process variables across sites.
- Automated work orders generated directly from sensor thresholds instead of manual inspection schedules.
- Predictive maintenance that flags failing bearings, motors, or compressors weeks before breakdown.
- Digital twin feeds that let engineers simulate failure scenarios against live operating data.
The stakeholders who consume this data rarely sit in one department. Edge and OT teams care about signal quality and uptime. Facility and maintenance teams care about whether a reading becomes a work order. IT cares about how the data lands in ERP or a CMMS without breaking existing workflows. Successful integration projects design for all three from day one, not as an afterthought once the sensors are already deployed.
Core Components and Architecture Patterns
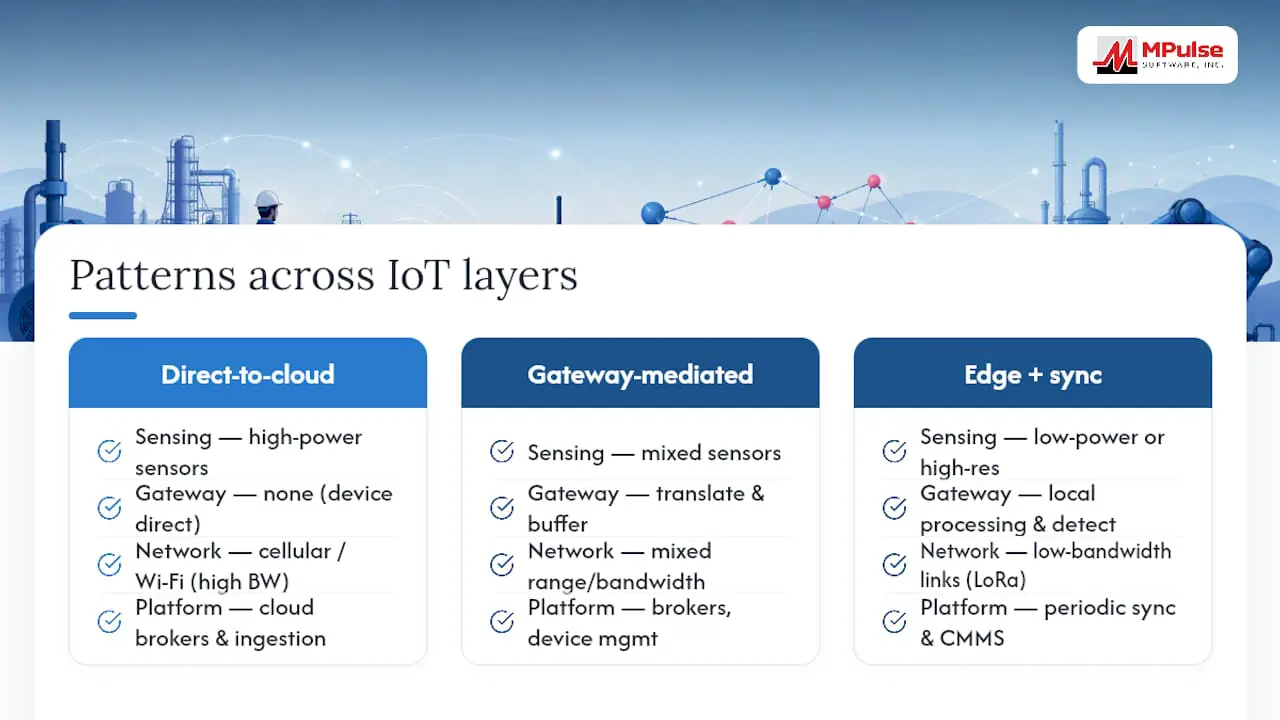
Every integration project touches four layers, and skipping planning on any one of them shows up later as a support ticket.
Sensing layer. Sensor selection depends on the physical quantity you’re measuring and the resolution you actually need. A 12-bit ADC is plenty for most temperature and humidity readings; vibration analysis for bearing failure often needs 16-bit resolution and a sampling rate in the kilohertz range. Calibration drift is the silent killer of long-running deployments. Build a recalibration schedule into your maintenance plan before the sensors ship, not after false readings start piling up.
Edge and gateway layer. Gateways handle protocol translation, buffering during outages, local preprocessing, security enforcement, and over-the-air updates. A gateway that only forwards raw data is underused hardware; push filtering and anomaly detection here to cut bandwidth and cloud compute costs.
Network layer. Cellular, LoRaWAN, NB‑IoT, Wi‑Fi, and satellite each trade range against bandwidth and power. There’s no universal winner; the choice depends on site topology and duty cycle.
Platform layer. This is where MQTT brokers, device management consoles, ingestion pipelines, and CMMS connectors live.
Three architecture patterns cover most deployments: direct-to-cloud for simple, high-power devices; gateway-mediated for mixed-protocol fleets; and edge-processing with periodic cloud sync for bandwidth-constrained or latency-sensitive sites.
Pro Tip: Don’t design the gateway layer as a pass-through. A gateway that does local anomaly detection before forwarding data cuts both cloud costs and alert fatigue for the maintenance team on the other end.
How Do You Choose Between MQTT, CoAP, and LoRaWAN?
Protocol choice comes down to three constraints: device CPU and memory, power budget, and how much latency the use case can tolerate.
MQTT is the default for most gateway-to-cloud and platform-to-application traffic. It runs over TCP, handles quality-of-service tiers well, and every major IoT platform speaks it natively. The problem shows up on constrained nodes. A battery-powered sensor with a few kilobytes of RAM often cannot maintain a persistent TCP session and still hit its power budget. That’s where MQTT‑SN comes in: it preserves MQTT’s publish/subscribe model but runs over transports like UDP or ZigBee that don’t require a full TCP/IP stack, using a gateway to bridge back into the standard MQTT broker.
CoAP fills a similar niche for devices that need REST-style request/response semantics over constrained links, which makes it a natural fit when you want web-style integration without MQTT’s persistent-connection overhead.
For wide-area connectivity, the trade-offs are stark:
- LoRaWAN delivers multi-kilometer range and years of battery life at the cost of very low bandwidth, ideal for sparse sensor readings.
- NB‑IoT and LTE‑M ride existing cellular infrastructure with better bandwidth than LoRaWAN and moderate battery life, useful where carrier coverage already exists.
- Wi‑Fi offers high bandwidth but drains batteries fast and needs local infrastructure.
Recent academic surveys flag connectivity reliability as one of the primary technical challenges in large sensor networks, alongside energy management and interoperability, which is exactly why gateway-level protocol translation matters. Standards like IEEE 1451 and MTConnect give that translation layer a vendor-neutral target instead of a proprietary one.
Implementation Checklist: From Scoping to Rollout
Skipping steps here is how pilots turn into six-month science projects. Work through these in order.
- Scope the use case and define success metrics. Decide sampling rate, acceptable latency, target mean time to repair, and how much false-alarm tolerance the team will accept before the alerts get ignored.
- Select hardware and plan power. Match sensor accuracy to the actual failure mode you’re tracking, then decide between battery, mains, or energy harvesting based on mounting location and maintenance access.
- Configure connectivity and the gateway. Pick your protocol stack, size edge compute for any local preprocessing, and build the over-the-air update plan before deployment, not during the first firmware bug.
- Provision devices securely. Use certificates, TPMs, or secure elements for device identity. A sensor without a hardened identity is an open door into the network it reports on.
- Design the data schema. Standardize timestamps, normalize units, and document payload structure before the first device ships data, since retrofitting schema changes across a live fleet is painful.
- Test and pilot. Run a 60 to 90 day pilot that exercises real environmental conditions, not a lab bench. Monitor drift, connectivity gaps, and false-alarm rates before greenlighting a phased production rollout.
Pro Tip: Treat the 60 to 90 day window as non-negotiable. Shorter pilots miss seasonal power and connectivity swings; a structured pilot that spans at least one full duty cycle catches problems a two-week test never will.
What Challenges Come Up During Sensor Integration?
Four failure modes account for most of the support tickets in year one.
Power management is the most underestimated. Duty cycling extends battery life but adds latency between readings. Energy-harvesting designs stretch maintenance intervals further, though they demand tighter power budgeting and more upfront engineering than a simple battery swap plan.
Intermittent connectivity breaks naive designs fast. Store-and-forward buffering at the gateway, adaptive sampling that backs off during outages, and a secondary link for critical sites all reduce data loss without requiring perfect uptime.
Interoperability problems surface when every vendor speaks a slightly different dialect. Adopting standards like IEEE 1451 and MTConnect, and routing everything through gateway adapters instead of a proprietary end-to-end stack, keeps you from getting locked into a single vendor’s ecosystem.
Scale and device management get harder every time the fleet grows. Fleet-wide OTA updates, continuous device-health telemetry, and canary rollouts with rollback capability turn a 500-device fleet from a liability into a manageable asset.
- Build power budgets before hardware selection, not after.
- Assume connectivity will fail and design store-and-forward from day one.
- Standardize on IEEE 1451 or MTConnect gateway adapters rather than custom protocols.
- Pilot OTA updates on a small canary group before pushing fleet-wide.
Pro Tip: Security failures rarely start at the network layer. Secure boot and device hardening at the sensor itself stop a compromised node from becoming a pivot point into the broader network.
Industry Applications: Where Sensor Integration Pays Off
Manufacturing predictive maintenance is the clearest ROI case. Vibration and temperature sensors feed edge anomaly detection, and once amplitude or thermal drift crosses a threshold, that event automatically opens a work order in the maintenance system instead of waiting for a technician’s routine walkthrough.
Precision agriculture deployments favor modular, pole-mounted, solar-powered stations running LoRaWAN or cellular connectivity with onboard edge AI. Field-validated designs pairing low-power microcontrollers with edge processors have shown they can run unattended for extended periods while still delivering usable soil and plant metrics, which matters when the nearest power outlet is a mile away.
Cold-chain logistics relies on cellular or NB‑IoT temperature sensors that stream telemetry continuously and fire automated alerts the moment a shipment drifts outside its allowed range, creating an auditable chain-of-custody record that regulators and customers both expect.
Digital twin feeding takes the same sensor streams and routes them into simulation environments, letting engineers run root-cause analysis against a live model of the asset instead of guessing from historical logs alone.
The pattern repeats across all four: sensor, edge decision, and a system of record that turns the reading into an action.
Data Format Standards and Serialization for Sensor Data
The wire format you pick shapes bandwidth, parsing overhead, and how well downstream systems can consume the payload without custom code on every side.
JSON remains the default for human-readable, easy-to-debug payloads and integrates cleanly with almost every cloud platform and CMMS connector. Its cost is size. Verbose key-value pairs eat bandwidth that matters on constrained links.
CBOR (Concise Binary Object Representation) keeps JSON’s data model but encodes it in binary, cutting payload size significantly, which makes it a natural fit for LoRaWAN or NB‑IoT links where every byte counts against battery life.
Protocol Buffers go further by requiring a predefined schema, producing the smallest payloads and fastest parsing of the three, at the cost of needing schema files distributed to every consumer of the data.
For most fleets, the practical answer is mixed: CBOR or Protocol Buffers on the constrained sensor-to-gateway hop, JSON on the gateway-to-cloud hop where bandwidth is no longer the bottleneck and human-readable debugging matters more. Whichever format you choose, standardize timestamp format (ISO 8601 is the safe default) and unit conventions across the entire fleet before the first device ships. Mixed units and inconsistent timestamp formats are a recurring, entirely avoidable source of data-cleaning work downstream.
Connecting Sensor Data to SCADA, ERP, and Cloud Systems
Sensor integration rarely happens on a blank slate. Most engineering teams are threading new telemetry through systems that were never designed for high-frequency IoT data.
SCADA systems typically expect industrial protocols like Modbus or OPC-UA rather than MQTT directly, so gateway adapters that translate between IoT protocols and SCADA-native ones are usually necessary rather than optional. Trying to force SCADA to speak MQTT natively is a common and avoidable rework cycle.
ERP integration usually happens one layer removed from raw telemetry. Sensor data gets aggregated and contextualized, often inside a CMMS or middleware layer, before it reaches ERP as a work order, an inventory draw, or a cost record. Feeding raw sensor streams directly into ERP tends to overwhelm systems built for transactional records, not high-frequency time series.
Middleware platforms and managed cloud device services increasingly replace custom-built gateway fleets for this translation work. Relying on managed connectivity services instead of hand-built gateway infrastructure cuts the ongoing maintenance burden considerably, particularly for organizations scaling across many sites where custom gateway code becomes its own liability.
The practical takeaway: design the CMMS or middleware layer as the translation point between high-frequency sensor data and the transactional systems that were never meant to see it directly.
Turning Sensor Data Into Something a Team Actually Uses
Raw telemetry sitting in a database delivers zero value until someone or something acts on it. That’s the gap between data collection and data analytics that trips up a lot of otherwise well-engineered pilots.
Dashboards matter, but the real payoff comes from rule-based automation layered on top of the data: threshold alerts, trend detection, and anomaly scoring that runs continuously instead of waiting for someone to check a screen. A vibration reading that quietly trends upward over three weeks is far more useful as an automated flag than as a line on a chart nobody’s watching on a Tuesday afternoon.
Mapping integrated sensor data into automated maintenance reporting is where predictive maintenance actually becomes predictive rather than reactive with better graphs. The pattern that works: edge or cloud analytics score incoming readings against historical baselines, cross a threshold, and fire a triggered event, which a CMMS or middleware layer turns into a work order, a technician assignment, and a parts reservation, all without a human in the loop until the technician shows up to fix the actual problem.
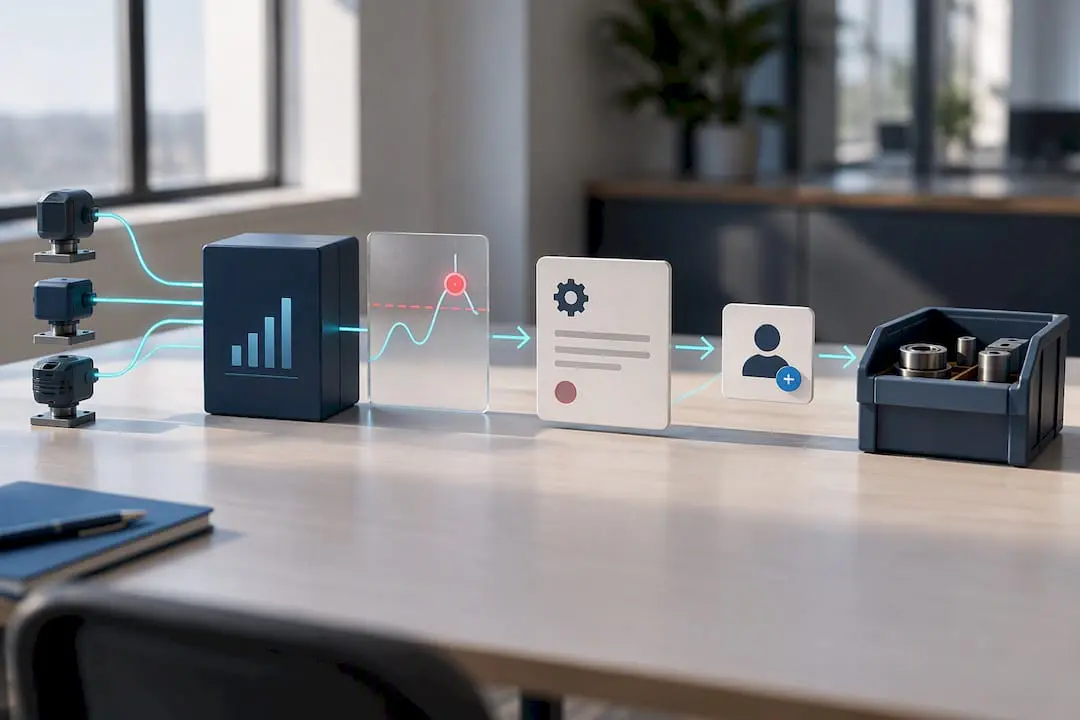
Visualization still matters for root-cause work. Engineers reviewing a failure after the fact need time-series overlays, not just a pass/fail alert log. Build both into the pipeline from the start: automated action for the routine cases, rich visualization for the ones that need a human to dig in.
MPulse’s CMMS-First Approach to Sensor Integration Pilots
A CMMS-first pilot mapping sensor thresholds directly to work-order triggers tends to shorten the path from raw telemetry to usable maintenance action, compared with building a custom analytics layer first and bolting maintenance workflows on afterward. Teams running IIoT telemetry through a CMMS report that automated meter readings and equipment telemetry map cleanly to existing work-order rules once the mapping logic is defined upfront rather than retrofitted.
Plan for a 60 to 90 day pilot, track a small set of clear metrics (false-alarm rate, MTTR change, technician response time), and set governance checkpoints at the 30-day and 60-day marks before committing to a fleet-wide rollout. MPulse customers cite efficiency improvements up to 40% when sensor-driven triggers replace manual inspection schedules, though results vary by facility and starting baseline.
— Mark
Standards and Guides Worth Bookmarking
For deeper technical grounding, read the NIST integration architecture for MTConnect and IEEE 1451, the MQTT‑SN explainer, and the connectivity survey covering energy and interoperability challenges.
Where MPulse Software Fits Into Your Sensor Integration Plan
MPulse Software gives engineering teams a CMMS built to sit at exactly the junction this article covers: the point where sensor telemetry stops being raw data and starts triggering real maintenance work. Instead of building custom logic to route sensor events into work orders, MPulse connects through its IIoT and real-time monitoring capabilities and the DataLink Integration Adapter to map sensor thresholds directly to automated work-order creation.
That matters most for teams running compliance-heavy or multi-site operations, where an intuitive calendar dashboard and flexible editions can reduce custom-integration work to configuration rather than code. If you’re planning a pilot, MPulse’s implementation services can help scope the sensor mapping and rollout timeline, and the Professional plan starts at $29 per month per user for teams ready to connect telemetry to real maintenance workflows now.
Sources
- Integration of MTConnect and standard-based sensor networks for manufacturing equipment monitoring
- Comprehensive survey on connectivity for IoT sensor networks
- What is IoT integration? — TechTarget
- Interoperable IoT/WSN sensing station with edge AI-enabled multi-sensor integration for precision agriculture
FAQ
What Is an IoT Sensor?
An IoT sensor is a device that measures a physical quantity, such as temperature, vibration, or humidity, and transmits that reading over a network to a gateway or cloud platform. Unlike a standalone sensor, an IoT sensor is built to communicate continuously, often over protocols like MQTT or LoRaWAN, so its readings can feed automated systems rather than sit on a local display.
Can You Give an Example of an IoT Sensor?
A vibration sensor mounted on an industrial motor bearing is a common example. It streams amplitude readings to an edge gateway, which flags abnormal patterns and can trigger a maintenance work order before the bearing fails outright.
What Are the Different Types of IoT Sensors?
Common categories include temperature and humidity sensors, vibration and accelerometer sensors, pressure sensors, proximity and motion sensors, and gas or chemical sensors. Each type serves different industries: vibration sensors dominate in manufacturing predictive maintenance, while temperature sensors are central to cold-chain logistics.
Should I Use MQTT or MQTT‑SN for My Sensor Fleet?
Use standard MQTT when devices can maintain a TCP connection and have enough power and memory to spare. Choose MQTT‑SN for battery-powered, memory-constrained sensor nodes that need MQTT’s publish/subscribe model without the overhead of a full TCP/IP stack.
How Long Should an IoT Sensor Pilot Run Before Full Rollout?
A pilot should run 60 to 90 days to capture a full duty cycle, including seasonal power and connectivity variation. Shorter pilots frequently miss the exact failure modes, like battery drain under cold temperatures or connectivity drops during peak network load, that show up in production.
Does MPulse Software Support IoT Sensor Integration?
Yes. MPulse Software connects sensor telemetry to work-order automation through its real-time monitoring capabilities and integration adapters, letting maintenance teams map sensor thresholds directly to CMMS-triggered actions.