
Asset condition scoring turns an inspector’s judgment about a pump, air handler, conveyor or roof into a number that every person on your team reads the same way. A score only helps if three things hold: the scale is defined in plain terms, the inputs behind it are repeatable, and the score stays attached to the asset record, where it can trigger preventive maintenance, repair or replacement. This guide covers each of those, with a worked example you can adapt.
It is written for facility managers, manufacturing and healthcare maintenance teams, school and campus operations, and contractors who need condition data they can defend in a budget meeting or an audit. When the scores live in the same system as your work orders, a poor rating becomes a task with an owner and a due date. That is what MPulse CMMS is built to support.
TL;DR
- Asset condition scoring combines inspection results, age, performance and maintenance history into one rating per asset, often called a condition index or asset health index.
- Pick one scale (1 to 5 or 0 to 10), define every level in observable terms, and use the same rubric for like assets. No universal standard exists, so yours has to be explicit.
- Condition alone does not set priority. Multiply or pair it with criticality so a failing critical asset outranks a worn but harmless one.
- Scores are only useful when they stay linked to the asset record, the work order history and the next scheduled inspection.
- Maintenance strategies that lean on preventive and predictive approaches are associated with markedly less unplanned downtime in published manufacturing research.
Table of Contents
- What asset condition scoring actually measures
- Choosing a rating scale
- Build the score from several inputs
- Combine condition with criticality
- Keep scores consistent across inspectors and sites
- Keep every score attached to its asset
- Turn scores into maintenance actions
- Healthcare, education and compliance settings
- Perspective: why we tie scores to work orders
- Where MPulse fits
- A first 30 days plan
- FAQ
- Sources
What asset condition scoring actually measures
A condition score describes the physical state of an asset at a point in time. It supports three decisions: what to maintain now, what to plan for in the next budget cycle, and what is approaching the end of its useful life.
The U.S. Army Corps of Engineers’ HydroAMP guide shows the structure well. It combines routine test and inspection results, equipment age, maintenance history and other condition indicators into a single Condition Index. It also uses two tiers. The first relies on routine operations and maintenance evidence. The second adds non-routine tests or inspections only when the first tier shows something worth investigating.
That tiered idea transfers directly to a plant or a hospital. Most assets get a quick, repeatable check on a schedule. Only the ones that score poorly, or that are critical, get a deeper look.
You will see several names for closely related things:
- Condition rating or grade: the score for one asset, such as a 3 on a 1 to 5 scale.
- Condition assessment: the inspection work that produces the rating.
- Asset health index: a rolled-up number that blends several inputs, sometimes across components or a whole site.
They are one workflow at different levels of detail.
Choosing a rating scale
There is no single correct scale. The published examples differ, and the guidance says so openly.
| Approach | Scale | How it reads | Source |
|---|---|---|---|
| Equipment condition index | 0 to 10 | 7 to 10 good, 3 to under 7 fair, 0 to under 3 poor | HydroAMP |
| Facility Condition Index (FCI), state example | Percentage | 0 to 15% good, 16 to 25% fair, 26 to 60% poor, over 60% critical | California DGS |
| FCI, academic suggestion | 0 to 1.00 | Under 0.05 good, 0.05 to 0.10 fair, over 0.10 poor | Uzarski and Grussing |
| Building Condition Index | 0 to 100 | 100 minus deduct values for observed distress | Uzarski and Grussing |
Two of these are worth explaining. The FCI is the cost of repairing identified deficiencies divided by the cost to replace the building, so it is a financial measure. The Building Condition Index starts at a perfect 100 and subtracts points for each observed defect, so it is an engineering measure. A 2021 study of both metrics concludes that pairing the financial view with the defect-based one gives a fuller picture than either alone.
The California Department of General Services notes that no industry-standard FCI rating scale exists and expects organizations to set ranges that fit their investigation depth and method. The academic bands are likewise described as not absolute or inflexible. Treat them as starting points.
A practical default: 1 to 5
For equipment-heavy operations, a 1 to 5 scale is easy to teach and easy to audit. Write each level as something an inspector can observe, not as an opinion:
- Very good: like new, no defects, performing to spec.
- Good: minor wear, no impact on performance, routine maintenance only.
- Fair: visible wear or intermittent faults, performance within tolerance, repairs likely within the planning horizon.
- Poor: frequent faults or measurable performance loss, repair or replacement should be budgeted now.
- Failed or unsafe: not performing, or a safety or compliance risk, act immediately.
Then add one or two examples per asset type. A 3 on an HVAC air handler might mean belt wear and a coil that needs cleaning but airflow still within spec. A 3 on a conveyor might mean bearing noise with vibration readings still under your alarm limit. Those examples are what keep two inspectors from scoring the same asset differently.
Build the score from several inputs
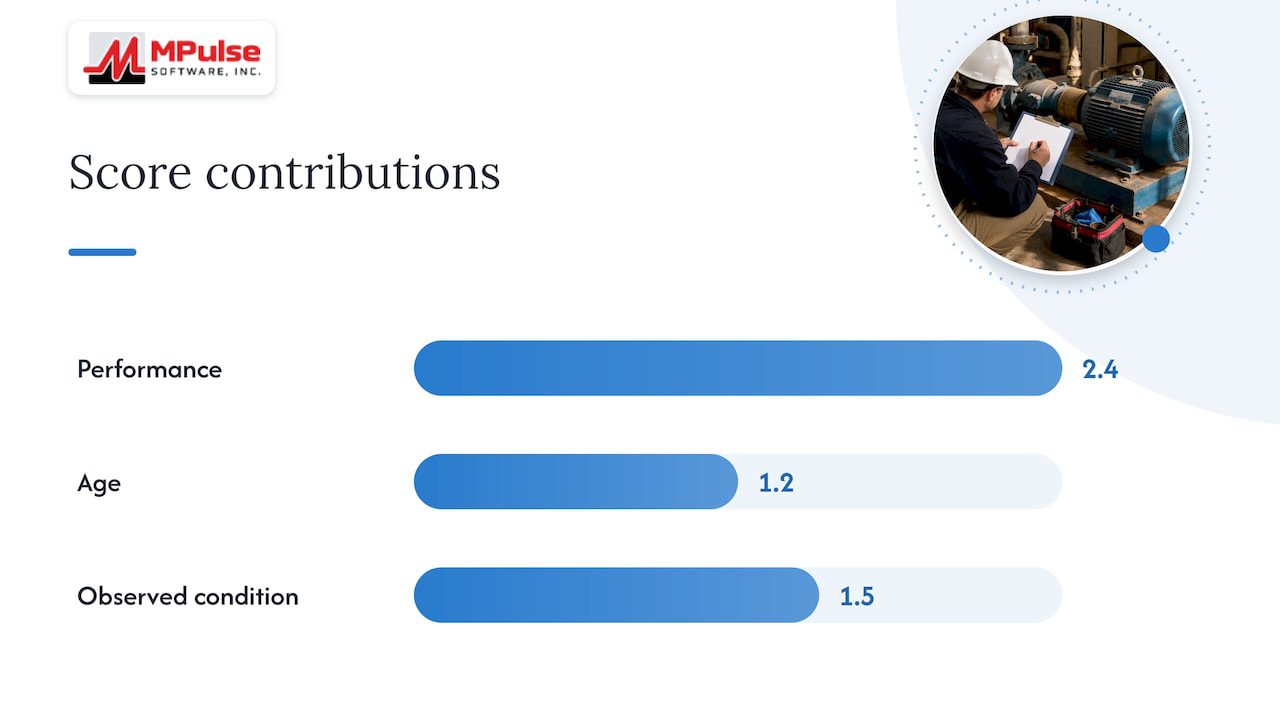
A single glance rarely captures condition. The Buildings magazine facility assessment article describes scoring equipment on performance, age and current observed condition, with the weight of each category adjusted to the organization’s priorities. It also suggests a customizable 0 to 10 scale and comparing each asset’s total with an acceptable score you set and with similar equipment.
Here is a worked example with illustrative numbers. A cooling-tower circulation pump is rated 0 to 10, where 10 is best:
| Input | Score | Weight | Contribution |
|---|---|---|---|
| Performance (flow and pressure vs. spec) | 6 | 40% | 2.4 |
| Age vs. expected service life | 4 | 30% | 1.2 |
| Observed condition (leaks, vibration, corrosion) | 5 | 30% | 1.5 |
| Condition score | 5.1 |
On the HydroAMP-style bands, 5.1 is fair. If your acceptable score for this class of pump is 6, the pump is below target and earns an inspection or a planned repair. If the same model at another site scores 7.8, the gap tells you something worth investigating.
Two habits make this work:
- Fix the weights before you score. Changing weights after the fact lets any asset look better or worse than it is.
- Record how confident you are. HydroAMP tracks a separate Data Quality Indicator so readers know whether a score rests on a fresh test or an old estimate. A simple high, medium or low flag on each score does the same job.
Rolling up to an asset health index
Once components have scores, you can aggregate them. HydroAMP rolls equipment results up into unit and station indices. In the Building Condition Index method, component-section indices let you track condition over the lifecycle, estimate deterioration rates and forecast future condition, which feeds short- and long-range work plans and budgets.
A practical rule: roll up only where the decision happens at that level. A building manager may want a score per building system. A technician needs the component score. Averaging hides a failing critical part inside a healthy-looking total, so keep the lowest component score visible next to any average.
Combine condition with criticality
Condition tells you how worn an asset is. Criticality tells you what happens if it fails. You need both to decide what goes first.
HydroAMP’s guidance is to use condition and cost as an initial ranking, then weigh safety, environmental, regulatory, legal and economic consequences for higher-stakes decisions. A simple version for a facility team:
| Low criticality | Medium criticality | High criticality | |
|---|---|---|---|
| Condition 4 to 5 (poor) | Plan replacement | Schedule repair soon | Act now |
| Condition 3 (fair) | Monitor | Add inspections | Increase PM frequency, plan spares |
| Condition 1 to 2 (good) | Routine PM | Routine PM | Routine PM, keep spares |
Define criticality with questions your team can answer: Does failure stop production? Does it affect patient care or life safety? Does it breach a regulatory requirement? Is there a backup? A fair-condition chiller serving an operating suite outranks a poor-condition fan in a storage room.
Keep scores consistent across inspectors and sites
Inconsistent scoring is the most common reason condition data loses credibility. The research points to a few controls:
- Use a common method. The California DGS guidelines require a common methodology across multiple buildings or systems so deficiencies are identified, evaluated and reported the same way.
- Use structured, repeatable inspections and tailor the condition standards to different buildings, systems and components, as Uzarski and Grussing recommend.
- Write the rubric down. The Buildings article stresses an explicit, organization-specific rubric that defines what counts as acceptable and compares like assets with like.
- Calibrate. Have two inspectors score the same five assets, compare, and rewrite any level definition that caused a disagreement.
In practice, this means a digital inspection checklist with the scale definitions attached to each question, completed on a phone or tablet at the asset. MPulse supports inspection checklists as part of its compliance recordkeeping, and its platform is compatible with mobile devices and barcode scanning, so the person scoring the asset is working from the correct record.
Keep every score attached to its asset
This is where many programs stall. A score in a spreadsheet or a consultant’s report goes stale the day it is filed. A score on the asset record sits beside its work order history, parts, manuals and next due inspection.
The scale of the problem is documented. A Naval Postgraduate School thesis analyzing NAVFAC records from fiscal years 2020 to 2024 found that only 2.29% of emergency, urgent and routine work orders could be traced to specific assets. With that little asset-level history, condition-informed analysis has almost nothing to work with. Condition scoring depends on a clean asset register and work orders that always name the asset.
A sound record setup includes:
- A unique ID and location for every asset, so work orders can be traced to it.
- Asset class, install date and expected service life, which feed the age input.
- The current score, the date, who scored it and the data confidence flag.
- The full history of previous scores, so you can see the deterioration rate.
MPulse’s guidance on creating CMMS asset records walks through setting up that foundation.
Turn scores into maintenance actions
The reason to score is to change what the team does. The U.S. Department of Energy’s Condition Assessment Survey guide notes that assessments help justify expenditures to extend useful life and show whether investments produced the expected results.
A workable action framework:
- Good scores: keep the standard preventive maintenance schedule.
- Fair scores on critical assets: shorten inspection intervals, stock key spares and add condition checks.
- Poor scores: generate a corrective work order or a capital request with the inspection evidence attached.
- Failed scores: escalate immediately and record the safety or compliance impact.
For assets that stream data, readings can feed the score directly. MPulse offers condition-based maintenance and IIoT and real-time monitoring, so meter and sensor readings can trigger work rather than waiting for the next walk-through. Sensor data works best when paired with context, a point covered in why predictive maintenance data alone is not enough.
What this does for downtime and utilization
Utilization improves when assets are available when production or patients need them. A study by Thomas and Weiss, published through PubMed Central, found that manufacturers relying more on preventive and predictive maintenance had 52.7% less unplanned downtime and 78.5% fewer defects than those relying mostly on reactive maintenance. Among manufacturers, those leaning more on predictive than preventive maintenance had 18.5% less unplanned downtime and 87.3% fewer defects in that comparison.
Condition scoring is how you decide which assets move from calendar-based to condition-based care, and where the extra effort pays back.
Cost matters too. The same NPS thesis reports that NAVFAC standard preventive maintenance tasks averaged $173.82, against a modeled $439.01 for tasks following original manufacturer guidance, and it recommends a hybrid approach based on asset value, age and risk. Condition and criticality scores are the inputs that make a risk-based approach like that practical.
Healthcare, education and compliance settings
If you maintain hospital equipment, school buildings or regulated production lines, the score has a second job: proving what you did and when. Inspection dates, scores, corrective actions and sign-offs all need to be retrievable. MPulse’s CMMS and compliance guidance covers how recordkeeping and parts inventory support audit readiness. Keep scoring evidence in the same system as the work order that closed the gap.
Perspective: why we tie scores to work orders
Over the years, we have watched maintenance teams invest real effort in condition assessments and then struggle to use them. The assessment gets done once, the report goes into a folder, and the next budget meeting starts from scratch.
Our view is that a condition score earns its keep only when it lives with the asset. It should sit beside the work orders, the inspection checklists and the preventive maintenance schedule, so a drop from 3 to 4 changes what happens next without anyone having to remember it.
That is why MPulse is built around the asset record, a calendar that shows planned work at a glance, and condition-based maintenance that can respond to readings. Teams that define their scale, keep it consistent and connect it to scheduling are the ones who move from reacting to failures toward planning around them.
Mark
Where MPulse fits
MPulse CMMS gives facility, manufacturing, healthcare and education teams a single place for assets, work orders, preventive maintenance, inventory and reporting. Condition scores recorded against assets can sit alongside that history and shape the schedule. The Professional plan is $29 per month per user and the Advanced plan is $79 per month per user. Implementation, training and consulting services are available to help set up your asset register and inspection routines.
See the plans on the pricing page, or review the implementation, training and consulting services if you want help building the register and rubric.
A first 30 days plan
- Week 1: list your critical assets and confirm each has a unique record, location and install date.
- Week 2: write the scale and level definitions for your top three asset classes, with one example each.
- Week 3: score a pilot group with two inspectors, compare results and tighten the definitions.
- Week 4: set acceptable scores and criticality ratings, then link each poor or fair critical asset to a scheduled inspection or work order.
After that, review scores on a fixed cycle. Comprehensive facility condition assessments are often done every three to five years, with routine rating updates in between during regular rounds. Use whatever interval your risk and regulatory obligations require.
FAQ
What is a good asset condition score?
It depends on your scale. On HydroAMP’s 0 to 10 index, 7 to 10 is good, 3 to under 7 is fair, and below 3 is poor. On a 1 to 5 scale where 1 is best, a 1 or 2 is good. Set an acceptable score for each asset class and compare against it.
Is an asset health index the same as a condition rating?
They are closely related. A condition rating scores one asset or component, while a health index usually blends several inputs, such as inspection results, age, performance and maintenance history, and may roll up across components or sites.
How often should assets be re-scored?
Match the frequency to criticality. Critical or fair-rated assets warrant more frequent checks during routine inspections. Stable, low-criticality assets can follow a longer cycle. Regulated equipment follows the schedule your regulator or accreditor requires.
How does condition scoring improve asset utilization?
Scores show which assets are drifting toward failure, so you can repair them in a planned window rather than during production or patient care. Fewer surprise stoppages means more available hours from the same equipment.
Sources
- Hydropower Asset Management Using Condition Assessments (HydroAMP)
- Infrastructure Study Guidelines, California DGS
- Building Condition Assessment Metrics: Best Practices
- Study on Condition Assessment Metrics based Facilities
- Why You Need to Do a Facility Condition Assessment, Buildings
- Final Review Submission, Part 2, Naval Postgraduate School
- Condition Assessment Survey Quick Reference Guide, U.S. Department of Energy
- Maintenance Costs and Advanced Maintenance Techniques, PubMed Central