
Connect your CMMS to Power BI through the method that matches its hosting model (API or ODBC for cloud systems, scheduled exports when native connectors aren’t available), pick a refresh pattern that fits your decision cadence, and model the data as facts and dimensions from day one. “Real time” rarely means instant. It means fresh enough for the decisions your team actually makes, delivered through a gateway and licensing tier that can sustain it.
TL;DR:
- Using native connectors accelerates integration by handling authentication and schema mapping, but APIs or direct database links are necessary for systems without native support.
- The optimal refresh pattern depends on decision needs, with Import mode suitable for daily updates and DirectQuery necessary for real-time monitoring within fixed refresh intervals.
- Building a star schema with clear fact and dimension tables and properly handling slowly changing dimensions ensures accurate reporting and prevents inflated counts.
- Always validate the data through sample extracts and assign clear ownership for IT, BI, and subject matter experts to prevent project stalls and ensure data quality.
- On-premises CMMS systems require a dedicated gateway, with configuration matching exactly to avoid refresh failures, and proactive monitoring improves long-term reliability.
Table of Contents
- What Are the Best Power BI CMMS Integration Methods?
- How Fresh Does Your Maintenance Data Need to Be?
- How Should You Model CMMS Data for Power BI Reporting?
- How Do You Reconcile Power BI Numbers Against the CMMS?
- What Security and Gateway Setup Does Integration Require?
- What Does a Power BI CMMS Integration Checklist Look Like?
- MPulse Perspective: What Integration Actually Requires
- How MPulse Software Supports Your Power BI Rollout
- Sources
- FAQ
What Are the Best Power BI CMMS Integration Methods?
The right connection method depends on where your CMMS lives and how much engineering support you have on hand. There is no single correct answer here, but there is a clear decision tree.
If your CMMS vendor ships a native Power BI connector, start there. It handles authentication and schema mapping for you, which cuts implementation time significantly. When no native connector exists, a REST API is usually the next best option. It supports incremental pulls and works well for cloud-hosted systems, though your BI team will need to build and maintain the API calls in Power Query.
Direct database connections through SQL or ODBC give you the most granular control and tend to work best for on-premises CMMS platforms with a well-documented backend schema. OData feeds are common in ERP-adjacent systems and behave similarly to APIs but with more standardized query syntax. Scheduled CSV exports are the fallback when nothing else is available. They are simple to set up but introduce manual steps and latency that make them a poor fit for anything beyond monthly or weekly reporting.
Middleware or ETL pipelines (tools like Azure Data Factory) become worthwhile once you are pulling from more than one system, or when transformation logic is too complex for Power Query alone.
Before committing to any method, run a connectivity test with a sample extract. Pull one month of work order data and confirm the field mappings, timestamps, and asset IDs come through clean. Assign ownership clearly:
- IT owns credentials, network access, and gateway configuration.
- The BI team owns the data model, DAX measures, and refresh schedule.
- A maintenance subject matter expert validates that KPIs and asset hierarchies reflect how the floor actually works.
Skipping that sample-extract step is the single most common reason integration projects stall midway through.
How Fresh Does Your Maintenance Data Need to Be?
Power BI offers three core refresh architectures, and picking the wrong one is where most CMMS dashboards go wrong. Import mode loads a full copy of your data into Power BI’s in-memory engine on a schedule. It’s fast to query and works for the vast majority of maintenance reporting, where “as of this morning” is fresh enough. DirectQuery queries your CMMS database live, every time a user opens a report or changes a filter. Hybrid models combine both: incremental refresh handles historical data in Import mode while a DirectQuery partition covers the newest transactions.
Power BI’s technical limits matter here. DirectQuery refresh schedules support fixed intervals of 15, 30, 60, 120, or 180 minutes — you cannot set a custom cadence outside those windows. Hybrid incremental-refresh-plus-DirectQuery patterns typically require Premium capacity, and related tables in that setup need Dual storage mode or you’ll run into relationship and performance penalties.
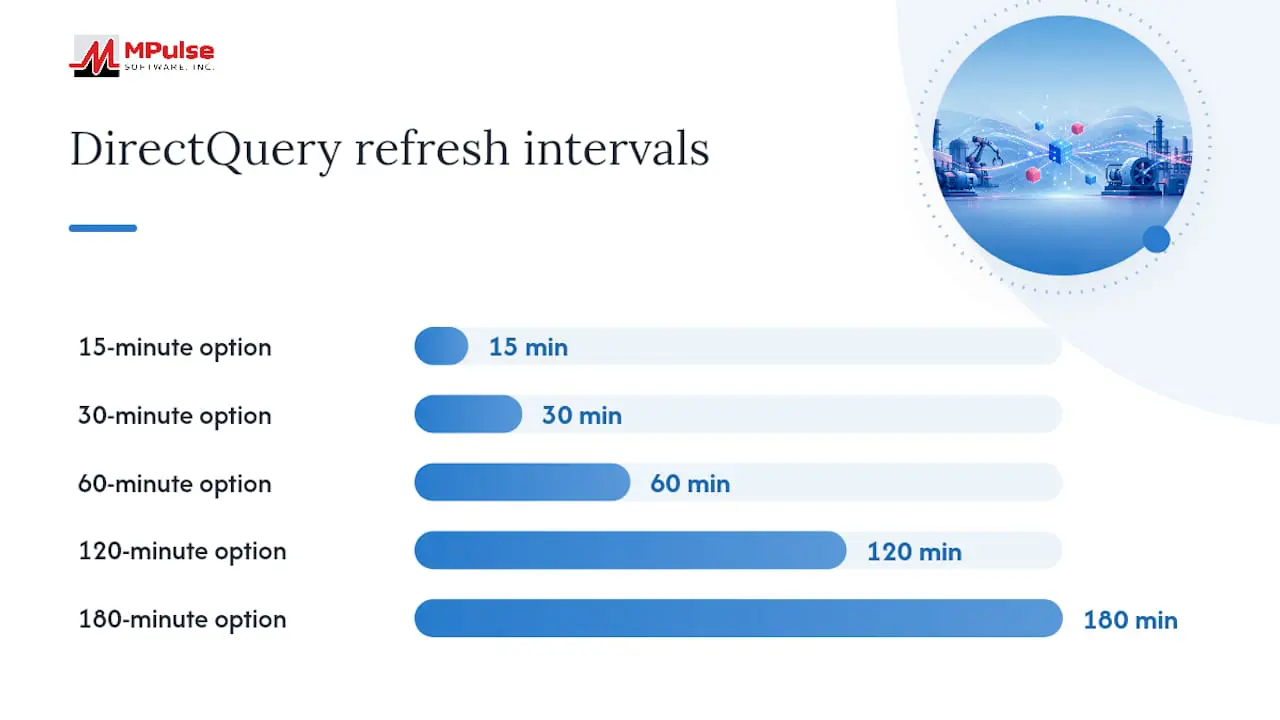
Statistic callout: DirectQuery refresh frequency has a minimum interval of 15 minutes between refreshes. If your maintenance team needs minute-by-minute alerting, Power BI’s scheduled refresh isn’t the mechanism. That calls for a different alerting layer entirely, not a tighter refresh interval.
Here’s the rule of thumb worth following: choose the least-fresh architecture that still supports your decision cadence.
- If supervisors check dashboards once per shift, Import with a daily or twice-daily refresh is plenty.
- If dispatchers need current work order status throughout the day, a DirectQuery partition on the transactional fact table (with historical data on incremental refresh) is a better fit.
- If you’re chasing minute-level freshness for a handful of critical assets, isolate those into a small, dedicated DirectQuery report rather than forcing your entire model into that pattern.
How Should You Model CMMS Data for Power BI Reporting?
Microsoft’s own guidance is unambiguous here: build a star schema, with fact tables holding transactional events and dimension tables holding descriptive attributes. For maintenance data, that split looks like this:
Fact tables:
- Work orders (one row per work order or per status change, depending on your grain decision)
- Labor hours logged against work orders
- Parts consumed
- Downtime events
- Cost transactions
Dimension tables:
- Date (with fiscal periods if your organization reports that way)
- Asset
- Location
- Technician
- Maintenance type (preventive, corrective, predictive)
- Status
The grain trap catches nearly every first-time modeler. Joining work orders directly to labor and parts at the raw row level, without controlling for grain, multiplies counts and inflates cost totals. Star schema guidance from Microsoft recommends either aggregating to a deliberate grain before the join or keeping labor, parts, and downtime as separate fact tables connected through shared dimensions rather than flattened into one master table.
Asset ownership and site assignments change over time, and that’s where slowly changing dimensions come in. A Type 1 approach overwrites the old value, which is fine if you don’t care about historical accuracy. A Type 2 approach creates a new versioned row with an effective date, which preserves the correct historical attribution when a work order needs to stay tied to the site or owner that existed at the time the work was done. For most compliance-driven maintenance operations, Type 2 with surrogate keys is worth the extra modeling effort.
Pro Tip: Build your first version of the model with just three DAX measures: PM Compliance Rate, Mean Time to Repair (MTTR), and Total Downtime Cost. Get those three validated against the CMMS before adding backlog counts, cost trends, or anything more complex. A small, trusted model beats a large, doubted one.
How Do You Reconcile Power BI Numbers Against the CMMS?
Power BI does not clean your CMMS data. If duplicates, reopened work orders, or missing completion dates exist in the source, they’ll show up in your dashboard exactly as they are. The most frequent culprits worth checking for:
- Duplicate work orders created by double data entry or failed sync retries.
- Reopened or cancelled orders that get counted twice if your fact table doesn’t track status history correctly.
- Missing completion dates, which silently break MTTR calculations.
- Inconsistent asset hierarchies, where the same asset appears under two different parent locations after a reorganization.
- Transferred labor hours logged against the wrong work order during a shift handoff.
Preserve the CMMS’s own source IDs and a last-updated timestamp on every fact table. That single habit is what lets you trace a number on a Power BI card back to the exact work order in the CMMS when someone questions it, and someone always will.
A short reconciliation checklist before go-live: pull ten random work orders and manually verify every field against the CMMS record; compare total open work order counts and total cost for the last closed period between Power BI and the CMMS’s own report; and assign a named validation owner, usually the maintenance SME, who signs off before the dashboard reaches leadership.
What Security and Gateway Setup Does Integration Require?
If your CMMS database sits on-premises or inside a private network, you need an on-premises data gateway or a VNet gateway to let the Power BI service reach it. The on-premises gateway is the standard choice for most maintenance operations; the VNet gateway is worth considering if your infrastructure already runs inside Azure virtual networks and you want to avoid installing gateway software on a physical machine.
Credentials configured in the gateway are encrypted and stored separately from your report file. For Windows-based CMMS databases, Kerberos-based single sign-on lets the gateway pass through the signed-in user’s identity rather than a shared service account. Microsoft Entra SSO serves a similar function for cloud-authenticated sources.
One detail trips up more implementations than it should: server and database names configured in Power BI Desktop must match exactly what’s registered in the gateway. A mismatch, even a typo in a hostname, causes refresh failures that look like permission errors but aren’t.
- Assign a clear gateway owner inside IT, not a shared responsibility that nobody actually monitors.
- For any dashboard leadership relies on daily, run the gateway in a cluster for high availability rather than a single machine.
- Check that gateway machines have the same database drivers and connector versions installed as the machine used to build the report. Mismatched drivers are a common, quiet cause of refresh failures.
- Monitor gateway health proactively rather than waiting for a failed refresh notification to surface the problem.
What Does a Power BI CMMS Integration Checklist Look Like?
A structured rollout keeps a CMMS-to-Power BI project from turning into an open-ended experiment. Follow this sequence:
- Discovery and scoping. List the CMMS entities you need (work orders, assets, labor, parts, downtime), the KPIs leadership actually wants, who owns each data domain, and any security constraints from IT.
- Connector selection and test extract. Pick the connection method that fits your hosting model, then pull a small sample dataset and validate field mappings before building anything else.
- Modeling and refresh configuration. Build the star schema, set up incremental refresh with RangeStart/RangeEnd parameters, add DirectQuery partitions if your cadence requires them, and write your core DAX measures.
- Gateway and workspace setup. Configure the gateway, publish to the right workspace, set the refresh schedule, and load-test the report with realistic user concurrency.
- Operational handover. Document a runbook for refresh failures, assign a reconciliation owner, and set up monitoring alerts for missed or delayed refreshes.
Pro Tip: Run your first full reconciliation before the dashboard goes anywhere near a leadership meeting. A single wrong MTTR number in front of an operations director does more damage to the project’s credibility than a two week delay ever will.
MPulse Perspective: What Integration Actually Requires
Most guidance on this topic treats the technical connection as the hard part. It isn’t. The hard part is what happens after the pipe is built: someone has to keep the asset hierarchy clean, decide how reopened work orders get counted, and own the reconciliation when a number looks wrong to a plant manager. That work never shows up in a Power BI tutorial, and it’s exactly where most maintenance teams underinvest.
MPulse Software approaches integration with that reality in mind. The DataLink Integration Adapter is built to expose CMMS data in a structure that maps cleanly to the fact-and-dimension model this article recommends, rather than forcing your BI team to reverse-engineer a schema. Combined with MPulse’s reporting features and its calendar-driven preventive maintenance workflow, the underlying data tends to arrive with fewer of the grain and reconciliation problems described above, because the source system already enforces consistent work order states.
Implementation services matter more than most teams expect going in. A vendor who understands both the CMMS schema and the Power BI side shortens the sample-extract and validation cycle from weeks to days.
— Mark
How MPulse Software Supports Your Power BI Rollout
If you already know your CMMS and Power BI need to talk to each other, the question left is who builds and maintains that connection reliably. MPulse Software’s DataLink Integration Adapter is built specifically to expose maintenance data (work orders, assets, labor, parts, downtime) in a structure that maps directly onto the star schema this article recommends, so your BI team spends less time reverse-engineering fields and more time building measures that hold up under scrutiny.
Beyond the adapter itself, MPulse’s CMMS Implementation Services pair you with a team that has done this integration work before, which shortens the discovery and test-extract phases considerably. Organizations that prefer not to manage servers can add Application Hosting Services to remove gateway maintenance from their own IT workload entirely. If you’re scoping a project now, request an integration scoping call and a data mapping worksheet, and check current plan details on the MPulse pricing page to see which edition supports the integration features your reporting plan needs.
FAQ
What Is the Best Way to Connect a CMMS to Power BI?
The best method matches your CMMS hosting model: use a native connector if your vendor offers one, a REST API or OData feed for cloud systems, and direct SQL/ODBC connections for on-premises databases. Scheduled CSV exports work as a fallback but introduce delay and manual effort.
Can Power BI Show Real-Time CMMS Data?
Power BI can approach near real time using DirectQuery, but refresh schedules for DirectQuery are limited to fixed intervals of 15, 30, 60, 120, or 180 minutes. For most maintenance teams, a well-scheduled Import refresh is fresh enough and performs faster than DirectQuery.
Do I Need a Gateway for CMMS Integration?
Yes, if your CMMS database is on-premises or inside a private network, you need an on-premises data gateway or VNet gateway to let Power BI refresh the data on a schedule. Cloud-hosted CMMS platforms accessed through an API generally don’t require one.
What KPIs Should a Maintenance Power BI Dashboard Track?
Start with PM compliance rate, mean time to repair (MTTR), downtime cost, and open work order backlog, since these four give leadership a reliable operational snapshot. Add cost trends and asset-level reliability metrics once the core measures are validated against CMMS totals.