
Oil analysis maintenance is a condition monitoring practice that reveals wear, contamination, and lubricant degradation before they cause failures. The immediate next action for any team starting or refining a program is straightforward: standardize sampling procedures and run a baseline test slate. Credible programs lean on established methods, including ICP-AES testing, FT-IR oxidation monitoring, and ICML-certified personnel, to keep trend data comparable over time.
TL;DR:
- Standardized sampling procedures and baseline tests are essential to ensure trend data accurately reflects equipment condition over time.
- Representative samples should be taken from correct locations using dedicated valves and proper flushing techniques to prevent contamination and data misinterpretation.
- Combining lab tests like ICP-AES and FT-IR provides early detection of wear, contamination, and oxidation, helping to prioritize maintenance actions effectively.
- Establishing a baseline with multiple samples under consistent conditions and tracking rate-of-change alerts can identify issues before static thresholds are exceeded.
- Connecting sample results directly to asset records and automated work orders enhances timely maintenance and prevents overlooked equipment issues.
Table of Contents
- Sampling methods and where to collect them
- Sample handling, storage, and chain of custody
- Common laboratory tests and what each one shows
- Turning lab numbers into maintenance decisions
- Building a program: tiers, frequency, and KPIs
- Connecting results to work orders and inspections
- Standards, lab accreditation, and on-site testing trade-offs
- Practitioner perspective: avoiding the mistakes that quietly ruin a program
- Putting oil analysis data to work in MPulse CMMS
- Sources
- FAQ
Sampling methods and where to collect them
Representative samples are the foundation of every reliable oil analysis program. A sample pulled from the wrong location, or with inconsistent technique, produces data that misleads rather than informs.
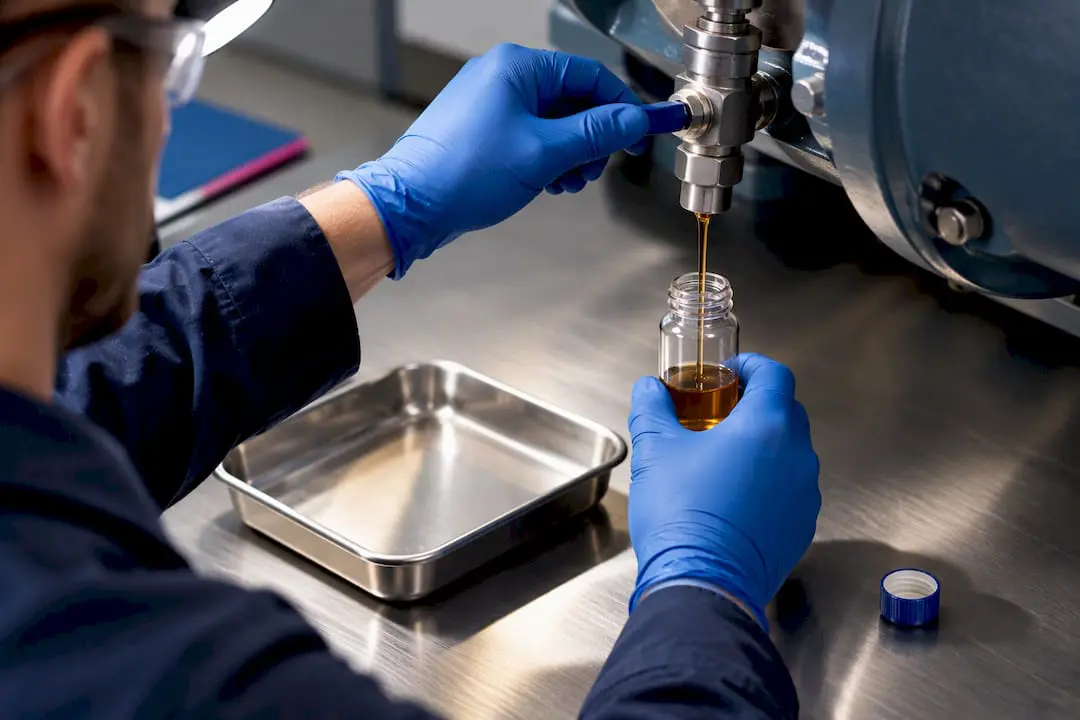
Live-line sampling draws oil while equipment runs, capturing the most representative snapshot of what circulates through bearings and gears. Drop-tube sampling works well for reservoirs and gearboxes without dedicated sample ports, though it carries a higher contamination risk if the tube touches the tank bottom. Pressurized-line sampling suits hydraulic systems with accessible valves, while cartridge sampling fits filtration systems where particulate capture matters more than dissolved chemistry.
Sampling location depends on the asset. Bearing housings call for a point downstream of the bearing and upstream of any filter. Gearboxes need mid-level draws that avoid settled sediment. Hydraulic systems benefit from return-line sampling after the system has run long enough to circulate contaminants. Turbines typically use dedicated sample valves positioned to reflect actual lubricant condition, not stagnant oil.
- Use dedicated sample valves or minimessage valves rather than dipsticks whenever possible.
- Flush sample ports before drawing fluid to clear standing oil and debris.
- Keep vacuum pumps and drop tubes dedicated to a single asset to prevent cross-contamination.
Sample handling, storage, and chain of custody
A perfect sampling technique means little if the bottle, labeling, or transport process introduces errors afterward. Sample integrity has to hold from the moment of collection until the lab opens the container.
- Use clean, particle-count-rated bottles matched to the test slate, and avoid reusing bottles across different assets.
- Flush the sample tube or valve with a small volume of oil before filling the bottle to purge residual contaminants from prior draws.
- Record asset ID, operating hours, oil hours, operating temperature, and sampler name on the label, since these fields are what make results trendable rather than isolated data points.
- Ship samples promptly, avoid extreme heat during transit, and refrigerate only when the test slate specifically requires it, such as certain microbial or moisture-sensitive analyses.
Skipping any of these steps rarely shows up as an obvious lab error. Instead, it quietly degrades the trend data that the whole program depends on.
Common laboratory tests and what each one shows
A well-built test slate answers different questions about the same sample. Choosing the right combination depends on the asset’s criticality and failure modes.
- Sweeping flat electrode spectrometry (ASTM D8315) captures larger, non-suspendable particles that ICP-AES tends to miss, which matters because those larger particles are often the earliest sign of severe wear.
- FT-IR spectrometry (ASTM D7414) tracks oxidation products through spectral bands between 1800 and 1670 cm-1, built for trend analysis rather than a single absolute reading.
- Viscosity (D445), particle counting, water content, and glycol tests round out the core slate, covering lubricant thinning or thickening, cleanliness levels, and coolant intrusion.
Integrated on-site testers, described under ASTM D7417, combine several of these methods into one device for rapid triage. They trade some sensitivity for speed, which makes periodic full-lab confirmation worth keeping in the program even after on-site testing is in place.
Turning lab numbers into maintenance decisions
Raw results only become useful once they are compared against a baseline and tracked over time. A single reading rarely tells you much on its own.
Establish a baseline using three to six samples collected under defined, comparable operating conditions before treating any single result as normal or abnormal. From there, rate-of-change alerts, sometimes called add-rate limits, often catch problems earlier than static thresholds because they flag the slope of a trend rather than a fixed number. Noria’s program guidance recommends this approach for particle counts, wear metals, ferrous density, and acid number.
- A rise in sodium or potassium together typically points to coolant intrusion.
- A shift in boron often signals a change in additive package or external contamination.
- A spike in iron usually indicates bearing or gear wear and warrants an inspection before the next scheduled service.
Each of these signatures should map to a specific action, not just a note in a file.
Building a program: tiers, frequency, and KPIs
A program that treats every asset the same wastes budget on low-risk equipment while under-testing the assets that matter most.
- Tier assets by criticality: critical assets get a full slate (ICP-AES, FT-IR, particle count, viscosity, water), routine assets get a reduced panel, and low-risk assets get periodic baseline checks only.
- Set sampling cadence to match risk and operating hours, sampling critical rotating equipment more frequently than standby or low-duty assets.
- Track KPIs that prove the program’s value: trend density (samples per asset per year), mean time to detection of an emerging fault, oil life extension, and the count of failures prevented by early flags.
Tiering this way keeps routine sampling proportional to actual risk rather than uniform across the fleet.
Connecting results to work orders and inspections
Lab results only pay off when they trigger action. Recording sample ID, test slate, flagged elements, and trend rate against the asset record turns a lab report into a maintenance decision.
- Store sample history directly on the asset record so technicians see the full trend, not just the latest report.
- Configure conditional alerts that generate a work order automatically when a wear metal or particle count crosses its rate-of-change limit.
- Link an abnormal iron or particle count reading to an inspection task first, then to a scheduled repair or part replacement if the inspection confirms wear.
A condition-based maintenance setup that automates this chain removes the lag between a lab flag and a technician’s next step.
Standards, lab accreditation, and on-site testing trade-offs
Comparable results depend on consistent methods. D5185, D7414, D8315, and D7417 form the backbone of most commercial test slates and let you compare results across labs and time periods.
- Confirm lab accreditation and published detection limits before committing to a provider.
- Review reporting format and turnaround time, since a report that arrives too late to act on loses most of its value.
- Ask how the lab handles sample intake and hold times, since delays before testing can skew moisture and particulate results.
- Use on-site integrated testers for rapid triage, but schedule periodic lab confirmation to catch anything the on-site unit may underreport.
Practitioner perspective: avoiding the mistakes that quietly ruin a program
The most common failure in oil analysis maintenance is not a bad test. It is inconsistent sampling that makes trend data unreliable before it ever reaches an analyst. Standardizing sample points, training samplers on flush procedures, and linking every result to the CMMS asset record fix most of the damage within a single quarter.
— Mark
Putting oil analysis data to work in MPulse CMMS
Lab reports only create value once they reach the people who schedule work. MPulse CMMS stores sample histories against asset records, triggers work orders when a reading crosses a set limit, and tracks the KPIs that show whether a program is catching problems earlier. Teams ready to connect condition data to scheduled maintenance can review MPulse pricing starting at $29 per month per user for the Professional plan.
Sources
For test method detail, see D5185, D7414, D8315, and D7417. For program design guidance, see Noria’s Oil Analysis Basics and ICML certification information.
- D5185 Standard Test Method for Multielement Determination of Used and Unused Lubricating Oils and Base Oils by Inductively Coupled Plasma Atomic Emission Spectrometry (ICP-AES)
- D8315 Standard Test Method for Determination of Wear Metals and Contamination Elements in Used Industrial Oils by Sweeping Flat Electrode Atomic Emission Spectrometry
- D7414 Standard Test Method for Condition Monitoring of Oxidation in In-Service Petroleum and Hydrocarbon Based Lubricants by Trend Analysis Using Fourier Transform Infrared (FT-IR) Spectrometry
FAQ
What kind of maintenance is oil analysis?
Oil analysis is a condition monitoring technique used within predictive and preventive maintenance programs. It measures lubricant chemistry and wear particles to reveal equipment condition without disassembly.
Is oil analysis predictive maintenance?
Yes, oil analysis is a core predictive maintenance tool because it detects developing faults, such as bearing wear or coolant contamination, before they cause a breakdown. Trending results over time, rather than reading a single sample, is what makes the practice predictive.
What can an oil analysis tell you?
Oil analysis can reveal wear metal levels, additive depletion, oxidation, contamination from coolant or dirt, and changes in viscosity or particle count. Tests like ICP-AES and FT-IR each highlight a different piece of that picture.
What is the process of oil analysis?
The process starts with a representative sample taken from a consistent location, followed by proper labeling and transport to a lab or on-site tester. The lab runs a defined test slate, and the results are compared against a baseline and trended over time to guide maintenance decisions.